Abstract
Microbial fuel cells (MFCs)are low power output and low power density devices due to many losses,which further leads to troubleshooting while operating under a certain procedure for any application. The study analyzes details for troubleshooting and identifies losses through an illustration of lab scale air cathode microbial fuel cell (MFC). During this procedure,the maximum current achieved is 7.88 mA,corresponding to a maximum power of 6.21 mW against a100 Ω external load resistance for the air cathode MFC. The maximum power density achieved by the air cathode MFC is1 465 mW/ m2 at 100 Ω. The calculated internal resistance of the cell is 169 Ω based on the maximum theoretical power from standard potentials of electrodes,maximum power based on OCV(open circuit voltage)and then actual achieved power. The analysis concludes that overpotentials of electrodes and ohmic losses are the two significant losses that need to be reduced to enhance the power output of MFC. Achievement of a standard polarization curve is possible through supervision of these troubleshooting.
Keywords
0 Introduction
Research indicates that the novel microbial fuel cell(MFC)is popular for bioelectricity production[1].Despite the widespread benefits of MFCs,the applications of these devices have been hindered by low power output[2-3]. While identifying the factors that decrease power output,cell voltage or current,it has been observed that the measured MFC voltage and current are noticeably lower during the process owing to a number of losses. In an open circuit state of MFC,when the resistance is infinite and no current flows,the produced OCV(open circuit voltage)is continuously lower than that projected by taking maximum potential calculations for the cell.Theoretically,the maximum attainable voltage,called emf,in an air cathode MFC having an acetate-oxygen couple is of the order of 1. 1 V,which is the difference between electrode potentials[2]. However,due to overpotentials at the anode and cathode as well as ohmic losses,the emf voltage and correspondingly the higher power output can never be achieved. Logan et al.[4]presented a critical review of the methodology and technology of microbial fuel cells and identified factors that decrease cell voltage during the process,as well as methods for calculating and reporting electrical data. Logan[5]thoroughly discussed the architecture and procedure for reporting electrical data of MFCs. Watson and Logan[6]analyzed polarization methods for power overshoots in MFCs. Simeon et al.[7]demonstrated the potential of human urine to reduce internal losses in soil MFCs and to deliver steady power densities across various external resistors.Karamzadeh et al.[8]prepared a mathematical model to depict the polarization curve by considering losses.Taufemback et al.[9]presented a review of techniques for finding and interpreting polarization curves from MFCs. It also delivered a discussion about the mathematical modeling strategies of polarization curves as a procedure for obtaining insights into electrochemical phenomena and their effects on MFCs’performance. AI Balushi et al.[10]provided advancements for the reduction of activations overpotentials,concentrations and ohmic losses by reducing the concentration of substrate,increasing current density,using better membrane materials,and improving the design of electrodes and cathode catalysts. The major research gap is that actual real-time observations of any cell have not been illustrated for any MFC,and this motivates the researchers of this study to present an analysis of lab-scale MFCs. The novelty of this work is to make this lab-scale pilot assembly a pathway to analyze the factors responsible for low power outputs.This study analyses the occurrence and reasons for decreased voltage and low power output for lab scale air cathode MFC.
Standard Practice
The standard practice for data reporting,testing,and validation of any fuel cell or MFC is through polarization curves and power density curves. The analysis and characteristics of fuel cell or MFC polarization curves are the only prevailing tools. The polarization curve is used to characterize current or resistance as a function of voltage and to depict the performance analysis of the maintenance of MFC voltage as a function of current. The description of power as a function of current is derived from the polarization curve[5].
1 Material and Methodology
1.1 Identification of Factors for Low Power Output
For an oxygen cathode double chamber MFC with an acetate-oxygen couple,the maximum voltage is = 1.1 V[2]. The expected calculated maximum potential is always higher than the produced OCV of the MFC,but it is never achieved. The difference between anode E0 and the open circuit potential anode(OCPAn)is likely owing to bacterial activity for the achievement of maximum potentials. This difference arises because of the outcome of varying potential with the reduction of oxygen. As shown in Fig.1,there are three sections defining the decrease of voltage in MFC:
1)At a high range of external resistance,a rapidly varying voltage drops as current passes;
2)A nearby linear fall in voltage;
3)At high current densities,a second fast fall in voltage.
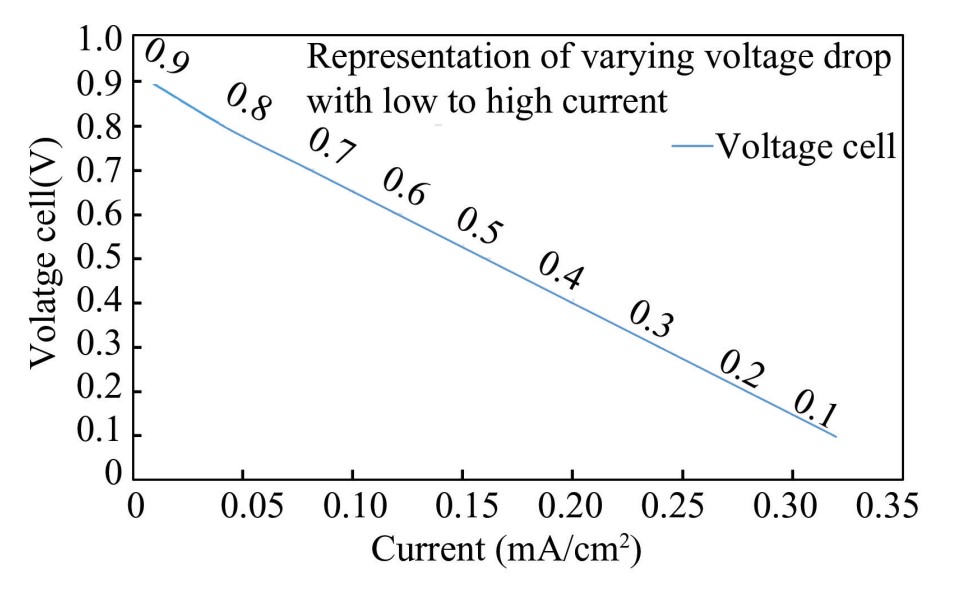
Fig.
1
General polarization curve
This decrease in produced MFC voltage at some particular current is assumed to be the effect of voltage loss which occurs due to overpotentials in electrodes and ohmic losses,as shown in Eq.(1):
(1)
where and are the anode and cathode overpotentials,respectively,and the I × R term represents all ohmic losses,which are further related to the generated current(I)and ohmic resistance of the system(R). The ohmic resistance is part of the total internal resistance and actually is the resistance from electrodes during electron transport,resistance from the electrolyte during migration of ions,and resistance due to the proton exchange membrane. The occurrence of overpotentials is at rapidly decreasing voltages,and low current density areas,but their magnitude is current dependent(over-potentials change with the specific current). The rise in occurrence of overpotentials is because of basic losses,which are activation,bacterial metabolism and mass transport. For the initiation of oxidation or reduction reactions and transfer of electrons to the electrode,energy is lost,and this loss is apparent at low current density and is named activation losses.The energy derived by bacteria during the oxidation of substrate due to bacterial metabolism is called voltage loss. Mass transfer losses occur when fluxes are inadequate,limiting the rate of electrochemical reaction,which further limits current production. The very specific reason for this limited rate or reaction is the limited supply of oxygen to the cathode.
In MFC operation,the substrate flux at the anode is an obvious problem. Proton flux from the anode is another problem as it leads to the accumulation of protons,which further affects pH and kinetics of bacterial growth. For optimization of MFC design,ohmic losses are the most significant to overcome.Ohmic losses take place from the opposition to the conductivity of ions and the flow of electrons to the output terminal and any intermediate connections.
1.2 MFC Internal Resistance
Polarization curve signifies that the beneficial range is largely present,and there is a linear relationship between the generated voltage and current density,and it happens only above a low value of current to the maximum power generation point,which is expressed as follows:
(2)
where Rint is the total internal resistance an MFC experiences while current passes through it. I is a generated current,R is the ohmic resistance,I × Rint is the MFC internal resistance losses,VOC represents the open circult voltage. The total internal resistance is due to ohmic resistance,diffusion resistance,and charge transfer resistance. Here I × Rint point towards the summation of MFC internal resistance losses and the amount of current passing through the cell. Due to relatively high internal resistance,the linearity of voltage and current has become a characteristic of MFCs.
A comparison of Eqs.(1)and(2)shows that electrode overpotentials contain the current varying internal resistance of MFC and are treated separately from ohmic losses. Hence,it is clarified that internal resistances and ohmic resistances are different and not interchangeable. Eqs.(1)-(2)indicate that losses due to overpotentials of electrodes and ohmic losses are treated separately. Also,it is imperative to note that the internal resistance of the cell includes overpotentials that are current-dependent. Researchers are still unable to separate the overpotentials and ohmic losses,so Rint includes all resistances and helps in the classification of MFC. As polarization curves become more nonlinear,losses decrease and power production increases.
1.3 Air Cathode Microbial Fuel Cell Assembly
MFC with an air cathode is assembled as per the proposed configuration in Fig. 2,with a natural zinc electrode of area 42. 4 cm2,without any surface modification,in an anodic chamber with 700 mL of dung slurry as substrate(anaerobic conditions),and air-exposed standard solid carbon material as cathode electrode of the same area as the anode[11]. The anaerobic conditions in the anodic chamber are an oxygen free environment to transfer and release electrons to the anode electrode at atmospheric pressure and a temperature near 35 ℃,which are conducive to microbial population. As the dung slurry substrate is organic,based on the population of microbes and microbial activity,the substrate concentration is dependent on the optimum pH value and temperature. The characterization of dung slurry is depicted through chemical oxygen demand and biological oxygen demand. Microbial analysis of slurry presents the identification and diversity of microbes.pH value influences the microgenic microbes,electrical conductivity,and an appropriate value is important for efficient transfer of electrons within the MFC. The cathode has been inserted in the Nafion 117membrane and placed on the lid of the anodic chamber container. The cathode electrode is 30% inserted in the membrane,which is further dipped in the substrate,and the rest is exposed to air,and the terminals are brought out. The properties of Nafion 117 membrane are as follows:perfluorosulfonic acid,chemically resistant,high ionic conductivity,and acts as a strong acid catalyst. An additional mediator,methylene blue of 300 μmol/ L,has been added to the anodic chamber to enhance the electron transfer rate. The methylene blue expedites the transfer of electrons from microbial film on the anode to the air cathode. It helps in stable power output as current production has increased. The significant parameters of MFC performance,such as current density and power density,improved with easy shuttling of electrons and the full exploitation of MFC potential. The output terminals are connected through a multimeter to measure the generation of OCV and the placement of the load.
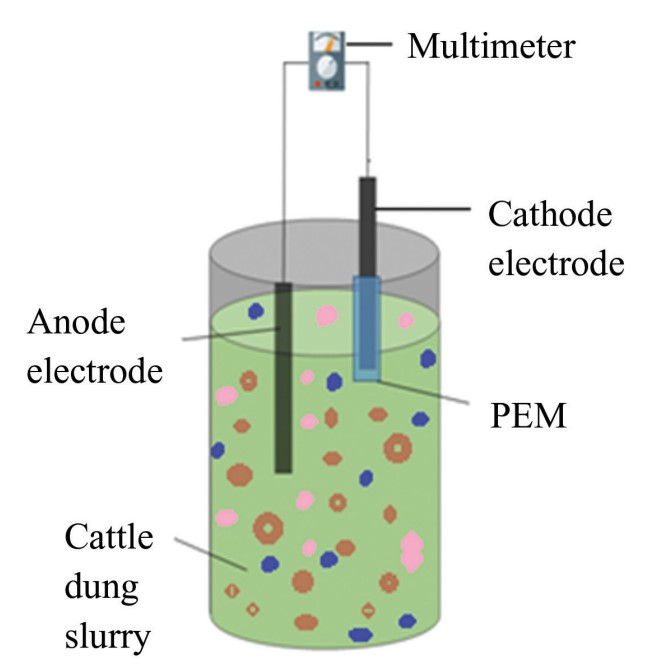
Fig.
2
Air cathode MFC assembly
As MFC behavior is more dependent on microbial activity and transportation,the standard operating procedure was followed to maintain operating conditions viz:availability of substrate,microbial community dynamics,stable inoculum,consistent pH,temperature,catalyst and oxygen supply. The monitoring and reporting of vital parameters in accordance with standard polarization and power density curves.
2 Results and Discussions
The preliminary parameters of the air cathode single chamber MFC under study were observed,and measured,the maximum achieved OCV was 1 292 mV,which is quite less than the OCP based on the anodic and cathodic potentials of the cell under study. The observations and measurements were made while the air cathode MFC was put across external load resistances. The results of observations are as follows.
2.1 Voltage,Current and Power
For the determination of voltage,current,and power parameters,the cell has been put across external load resistances ranging from 25 Ω to1 000 Ω. The voltage,current,and power have been measured across each resistance for the cell,and observations were recorded(as shown in Table 1).The maximum current achieved is 7.88 mA,corresponding to a maximum power of 6.21 mW against a 100 Ω external load resistance for the air cathode MFC. The maximum power density achieved by the air cathode MFC is 1 465 mW/ m2at 100 Ω.
Table
1
Parameters of air cathode MFC
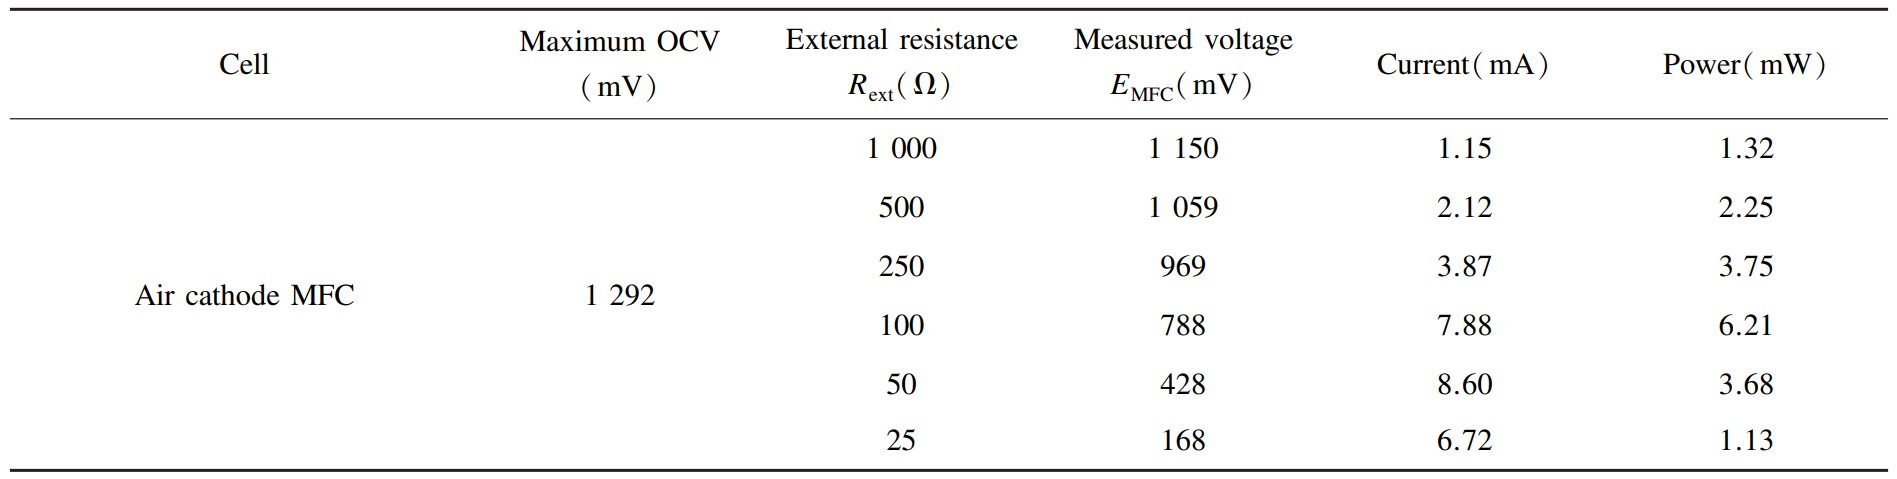
Electrically,the power output of a cell falls correspondingly at 50 Ω external load due to increased internal resistance at low load values,which further leads to internal losses and a sudden drop in power output. The electrochemical interpretation reveals that probable reasons are reduced reaction kinetics,a faulty biofilm on the cathode,or voltage reversal,resulting in loss of bacterial activity.
2.2 Polarization and Power Density Curve with Troubleshooting
The observations of cell voltage vs. resistance and cell voltage vs. current named polarization curves are presented in Figs. 3(a)and 3(b),respectively. The procedure used to acquire the polarization curves is a standard procedure for fuel cells or microbial fuel cells[5]. Fig. 4 shows the analysis of the obtained polarization curve for this lab scale MFC,presenting the behaviour of the parameters. OCV is 1 292 mV with infinite resistance and no current. Points 1 to 2 are the initialization of low current and rapid voltage losses due to overpotentials named activation losses.Points 2 to 3 are the region of constant voltage drop but with stable curve parameters showing ohmic losses,point 3 onward is the region of high currents but rapid voltage falls because of mass transport losses.This figure describes regions of losses,though it has not been statistically validated. In general,the literature studies reveal that activation losses can be reduced by increasing the surface area of the cathode or electrode composites to accelerate the oxygen reduction reaction at the cathode. Ohmic losses can be reduced by multi-layer design as part of structural changes and by utilizing highly conductive electrodes.On the other hand,with the cathode pore structure,the mass transportation losses can be minimized.
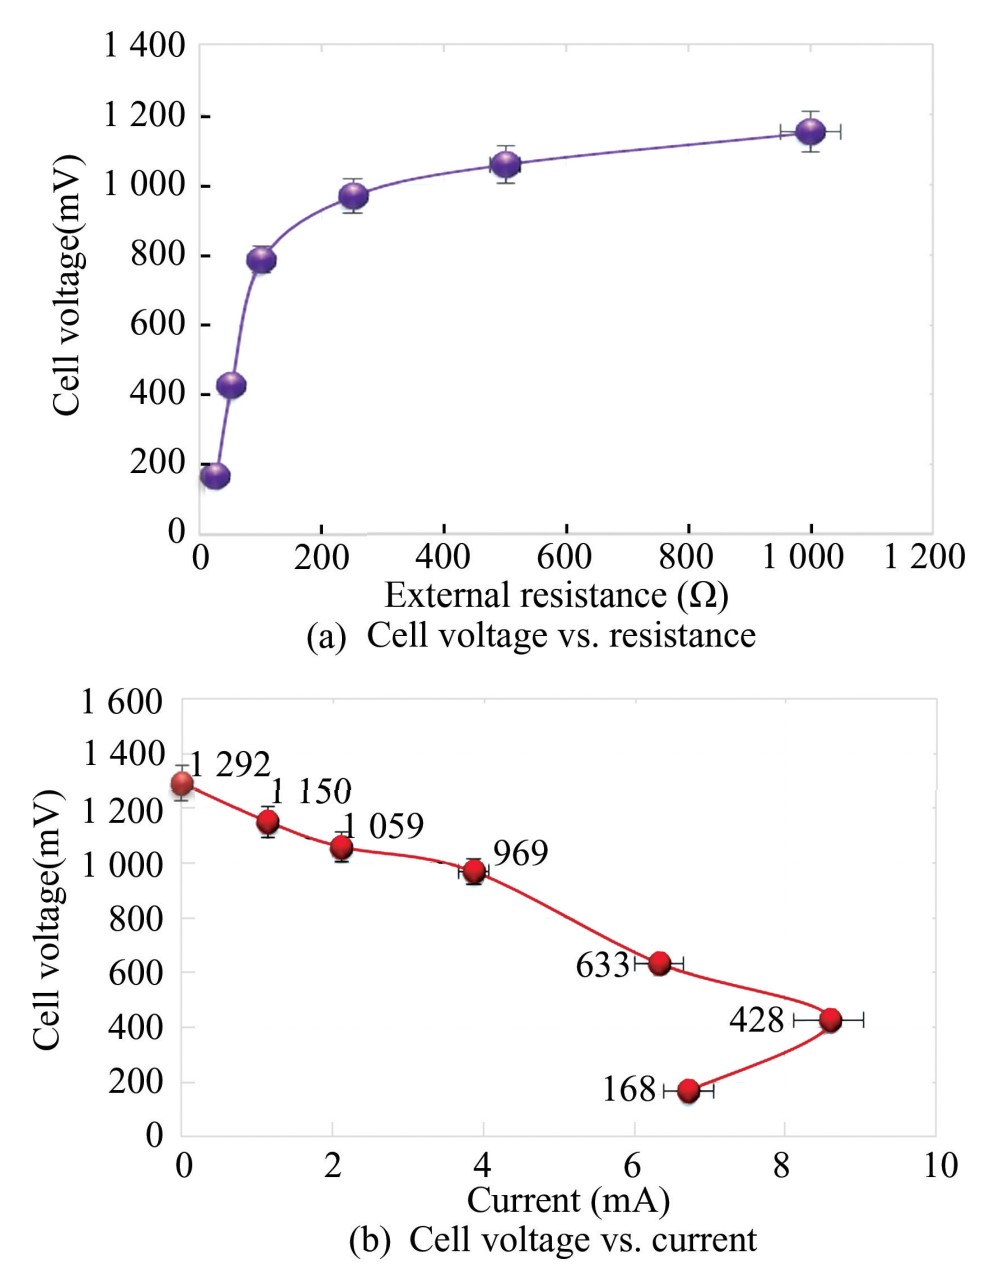
Fig.
3
Polarization curves
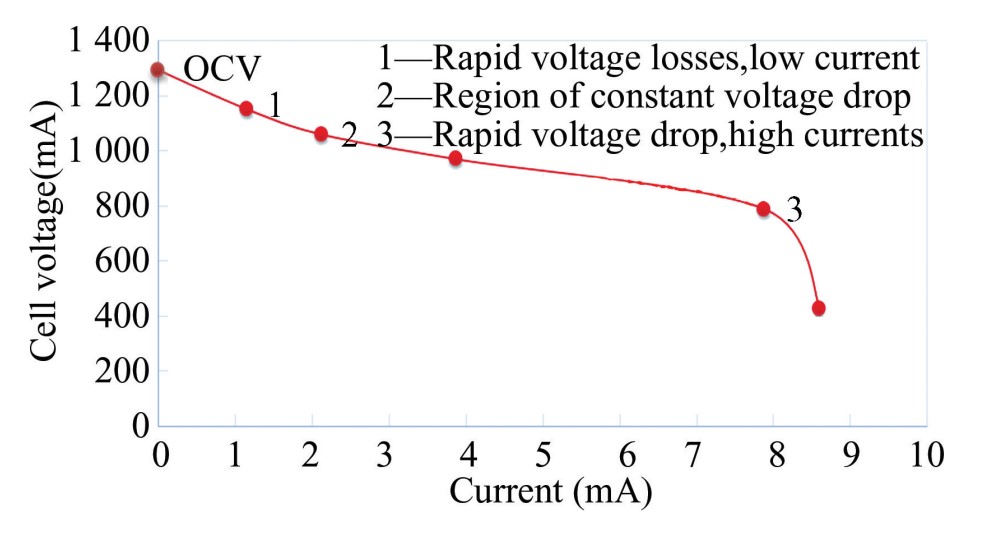
Fig.
4
Analysis of polarization curve
Fig. 5(a)presents the generalized power density curve,here Vopt is the optimum voltage,Iopt is the optimum current,Isc is the short circuit current,and Pmax is the maximum power achieved by MFC with various losses. Fig.5(b)shows the activation losses region,where activation losses occur at the start of oxidation or reduction reactions and during electron transfer,energy is lost due to low current density.Region of ohmic losses,are those,where oxidation is due to developed metabolism and bacteria derives the energy. Mass transport losses in the region show inadequate fluxes,and the rate of reaction is affected.
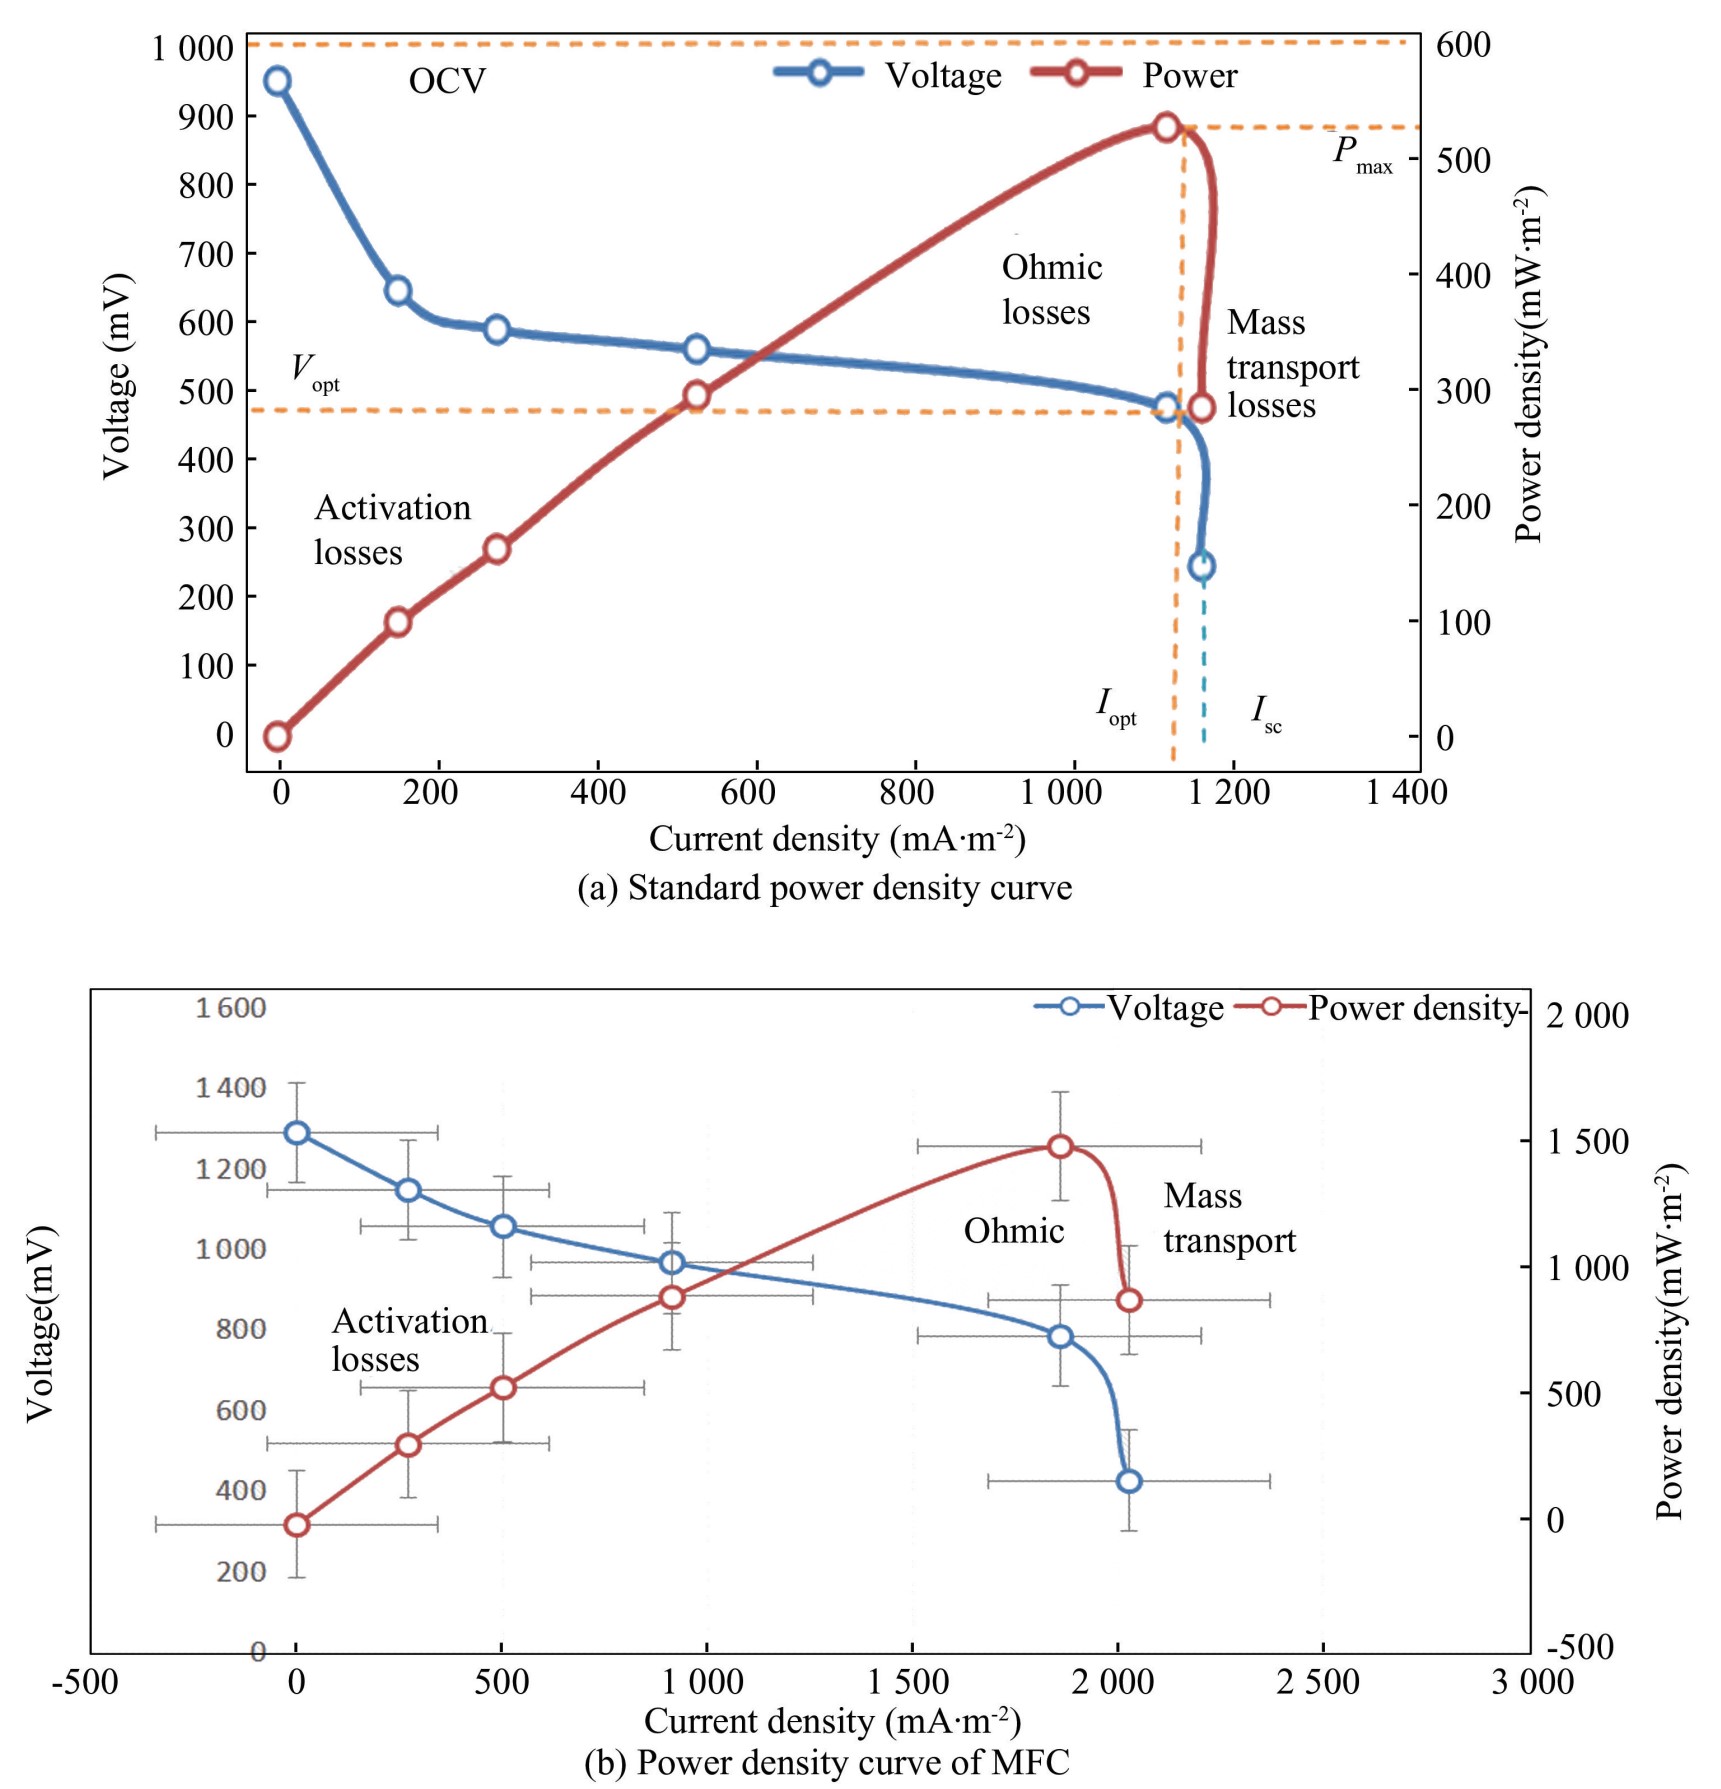
Fig.
5
Standard power density curve and MFC power density curve
For the optimization of MFC design,identifiying ohmic losses is essential,as they affect the conductivity of ions,the flow of electrons,and contact resistances.Table 2 presents the calculated internal resistance of the cell at 169 Ω based on the maximum theoretical power from standard potentials of electrodes,the maximum power based on OCV,and the actual achieved power. All theoretical and measured powers are calculated with zero internal resistance. Reducing spacing of electrodes,increasing conductivity,and reducing contact resistance can reduce the internal resistance of the cell and increase the power output of the cell.
Table
2
Calculated internal resistance

The performance of the power density curve depends on the voltage,current density,and power density of the cell. The choice of air cathode material highly influences the curve,significantly cell’s voltage and current parameters. These parameters further depend on the oxygen reduction rate and the catalytic activities of different cell materials,and on higher voltages with varying current densities. Kamperidis et al.[12]presented that manganese oxide combined with graphene and conductive polymers improves electrolytic characteristics,which further reduces losses and improves power density curves.
Various studies show that the internal resistance of a cell can be reduced by using high-conductivity electrodes with greater surface area,smaller spacing between electrodes,and improved current collection.For practical purposes,the optimization of these possible ways is more significant for the better performance of MFC. Tong et al.[13]presented that the conductivity of the cell can be improved by optimizing the spacing between electrodes using the Box-Behnken design.
3 Conclusions
The focus of the polarization and power density curve troubleshooting is to identify the various losses occurring during the operation of the air cathode MFC.The losses caused by low current density during the initiation of operation of the cell,which lead to activation losses,are followed by ohmic losses,which act as an obstacle to the flow of electrons,and are followed by mass transport losses due to the slow rate of reaction. Overpotentials of electrodes are the major cause of the internal resistance of the cell. Researchers have future scope for the reduction of internal resistance and other voltage losses to enhance the power output of cells.
Conflict of Interest
The author declares no potential conflicts of interest.
