Abstract
The main aim of this study is to apply the integrated multi-criteria decision-making (MCDM)approach of the best-worst method (BWM)and Tomada de decisao interativa multicriterio (TODIM)for multi-criteria optimization of parameters,namely mass fractions of Al2O3and Gr,applied load (AL),and sliding distance (SD)on specific wear rate (SWR),wear (WE),and coefficient of friction (COF)in the dry sliding wear process of AA7075 / Al2 O3/ Gr composites. In TODIM,overall dominance degree (ψi )represents SWR,WE and COF. The novelty of this work lies in the integrated application of BWM-TODIM for multi-criteria optimization of the wear process parameters and the percentage of reinforcements in composites. The Taguchi method (L18 )was used for the conduction of wear tests.According to the BWM-TODIM approach,optimized parameter levels of w(Al2O3 )of 3%,w(Gr)of 6%,AL of 10 N and SD of 2 000 m,yielded desirable wear criteria:SWR of 5.554×10⁻⁴ mm3/ (N·m),WE of 46.78 μm and COF of0.122. SEM analysis of the worn surface of the best alternative A16(optimal levels)showed better surface integrity as compared to that of the worst alternative A3. ANOVA of ψi revealed that parameters such as AL,Al2 O3and Gr were significant. The robustness and reliability of TODIM were analysed using sensitivity analysis. It revealed that it was highly robust with modification of criteria weights,fairly robust with variation of attenuation factor for losses (θ),and inconsistent with the majority of popular MCDM methods. Beyond the sensitivity analysis,TODIM was further validated by comparison with the multi-response optimizer like composite desirability function (CDF),and by performing a statistical validation test using bootstrapping,both of which yielded satisfactory results.
Keywords
0 Introduction
AA7075 has been used for making industrial parts for automobiles,aerospace,and other applications due to its desirable lightweight. It has higher micro-hardness,higher tensile strength and better fatigue resistance as compared to other aluminium alloys.Also,it is superior for achieving maximum strength at relatively low density[1]. This makes it suitable for aerospace and high-performance mechanical applications requiring these critical properties.However,it has a major problem of poor wear resistance that limits its wear performance. In addition,the ever-increasing global need for better quality materials with low cost has shifted AA7075 from monolithic alloys to composite materials. To build these composites with improved mechanical and wear properties to suit the specific application,a desirable quantity of ceramic reinforcements,such as Al2O3,TiB2,SiC,TiC,B4 C,zirconia,etc.,and solid lubricants such as Gr,h-BN,MoS2,etc.,are added to the matrix. Generally,tailored reinforcements are added to the original matrix to form hybrid metal matrix composites(HMMCs).Moreover,the wear performance of these composites depends on the percentage of reinforcements and wear parameters[2]. Specific wear rate(SWR),wear(WE)and coefficient of friction(COF)are key criteria for assessing wear performance of HMMCs.These criteria depend on the mechanical properties of reinforcements and matrix,the percentage of reinforcements,applied load(AL),sliding distance(SD),and the sliding velocity[3-4]. Slight variations in the composition of reinforcements and wear parameters have shown either superior or inferior performance[5].
To evaluate the wear performance,researchers need to conduct a large number of experiments,which consume a lot of time,effort and cost. Hence,many researchers have employed the Taguchi method and response surface methodology(RSM)to minimize the time,effort and cost of experimentation. Satish Kumar et al.[6]examined the effect of individual wear parameters on wear loss of A356 alloy-zircon metal matrix composites using Taguchi's L16 orthogonal array(OA)and concluded that zircon content was the most influential factor on wear loss,followed by the AL and SD. Vijaykumar et al.[7]explored the wear behavior of Al6061 composites with zircon mass fraction of 6%-12% using L27 OA and concluded that AL had a major impact on wear performance,followed by the speed and SD. Anusha et al.[8]designed Al7178 composites with a fixed B4 C mass fraction of 3%,TiO2and fly ash for wear study using central composite design and summarized that sliding speed was the most important for wear rate,followed by AL and the interaction between AL and SD.Ravikumar et al.[9]evaluated the wear loss and COF of Al7075/ SiC/ Al2O3composites and showed that the content of reinforcements had a major impact on them.Khan et al.[10]studied the wear performance of LM13aluminium alloy composites with SiC(mass fractions of 0%,10%,and 15%)using L27 OA. The variation of SiC in mass fraction had a dominant effect on wear rate and COF. Mohammad et al.[11]developed Al2O3-multi wall carbon nano-tubes reinforced A356composites using electromagnetic stirring and identified the optimal reinforcements for improvements in tensile strength,hardness and ductility. Ravikumar et al.[12]studied the effect of quenching media,SiC and Gr nano-reinforcements on the mechanical and wear properties of Al7075 hybrid composites. Their work proved that an increase in Gr content from 1% to3% led to a significant reduction in wear loss and a marginal reduction in strength. Patel et al.[13]investigated volume loss,volumetric wear rate,volumetric wear resistance,frictional force,wear depth,and relative wear depth of AA5052/ B4C composites and unreinforced AA5052. The results showed that composites exhibited better wear resistance and lower wear rates than the AA5052matrix.
Further,to improve the wear performance with respect to multi-criteria optimization of the percentage composition of reinforcements and wear parameters,several researchers utilized a plethora of optimization methods. Gajević et al.[14]improved wear performance of Al/ B4C composites using Taguchi method and artificial neural networks(ANN). Stojanović et al.[15]carried out optimization of wear parameters for A356/ Al2O3composites using RSM,ANN,genetic algorithm and particle swarm optimization method,and compared their results. Atta et al.[16]predicted the wear rate of A356 Al-Si/ Al2O3composites using ANN and multiple regression methods. Muthu[17]performed multi-criteria optimization of volume loss,frictional force,wear rate and COF for LM25composites using the Taguchi method and grey relational analysis(GRA). Stalin et al.[18]optimized the wear rate in AA6063-Si3 N4composites by using ANN and teaching-learning-based optimization along with GRA. Kumar[19]estimated the specific wear rate for five types of AA356-Al2O3/ SiC/ Gr composites using the Taguchi method and optimized it using a hybrid method of analytical hierarchy process and GRA. In addition,sensitivity analysis was conducted to test its stability by varying the weights. Fountas et al.[20]optimized wear rate of A356/ Al2O3nanocomposites using modern swarm intelligence algorithms such as grey wolf optimizer,moth-flame optimizer,dragonfly algorithm,and whale optimization algorithm to get global optimum results.Ragupathy et al.[21]predicted wear of AlMg1SiCu alloy composites using an adaptive neuro-fuzzy inference system and RSM. Ambigai and Prabhu[22]investigated the wear performance of stir-cast LM6alloy composites containing Gr and Si3N4.Furthermore,fuzzy logic was used to predict the wear rate of Al-Gr-Si3N4composites and compare it with the experimental results.
The aforesaid literature points out that these research works have very limited applications of MCDM methods and participation of decision-makers.In fact,MCDM is not sufficiently explored to solve wear optimization problems,though it provides consistent and considerably accurate results. Apart from this,equal weights were assigned to the considered wear criteria in the majority of earlier studies. It means that preferences of decision-makers were avoided,which might lead to bias and suboptimal results. On the contrary,MCDM methods allow decision-makers to choose criteria weights(subjective weights)in line with their preferences.Thus,there is scope for the application potential of MCDM methods in deciding criterion weights and optimization of the wear process[23-24]. Recently,the best-worst method(BWM),a subjective weighting method,has been applied for solving complex optimization problems in industrial engineering due to its advantages such as a smaller number of pairwise comparisons,less data requirement,vector-based calculations,and reliable results[25]. It has been used in decision-making problems shch as logistics[26],selection of a robot[27],product development problem[28],selection of suitable machines and materials[29],etc. But it depends on decision-makers'pairwise judgments,which may introduce subjectivity and potential inaccuracies. Another effective MCDM(multi-criteria decision-making)method,i. e.,TODIM(Tomada de decisao interativa multi-criterio)was proposed by Gomes and Lima[30]to find the optimal route for transportation of materials in a complex road environments. It mainly focuses on the overall dominance degree of each alternative over the others partially and globally. This feature makes it superior to other MCDM methods. It has been widely used in industrial engineering and management areas such as identification of the best location for a solar plant[31],supplier selection and development[ 32],material selection problem[33],selection of inventory policy in supply chain[ 34],etc. Nonetheless,it has a drawback of a lengthy calculation process that grows exponentially with the increase in the number of criteria and the inability to handle dynamic weights.
To date,BWM and TODIM have had limited applications in the field of parametric optimization of the wear process. Hence,it was decided to implement an integrated approach of BWM-TODIM for multi-criteria optimization of wear parameters for AA7075HMMCs on SWR,WE and COF. The criteria weights were determined by BWM and multi-criteria optimization of SWR,WE,and COF was done by TODIM. In addition,ANOVA was performed to identify significant parameters affecting all criteria,and confirmation experiments were carried out.Further,SEM analysis was done to confirm the better surface integrity at optimal parameters obtained by TODIM. To validate TODIM,the sensitivity analysis was performed to test its robustness and reliability by modifying the criteria weights,varying θ values,comparing it with popular MCDM methods and a multi-response optimizer like CDF. Finally,beyond the sensitivity analysis,it is validated through statistical tests like bootstrapping for ranking robustness of TODIM. The major contributions of the study are summarized as follows.
· HMMCs development & characterization:identification of a range of the percentage reinforcements,production of AA7075/ Al2O3/ Gr composites and comprehensive evaluation of their wear behaviour using SEM and EDAX analyses.
· Methodology:introduction of the integrated BWM-TODIM method for multi-criteria optimization in wear studies,enabling reliable ranking and parametric optimization.
·Robustness & statistical validation:verification of results through ANOVA,confirmation experiments and sensitivity analysis,ensuring both robustness and statistical significance of TODIM.
1 Experimental Details
1.1 Design of Experiments
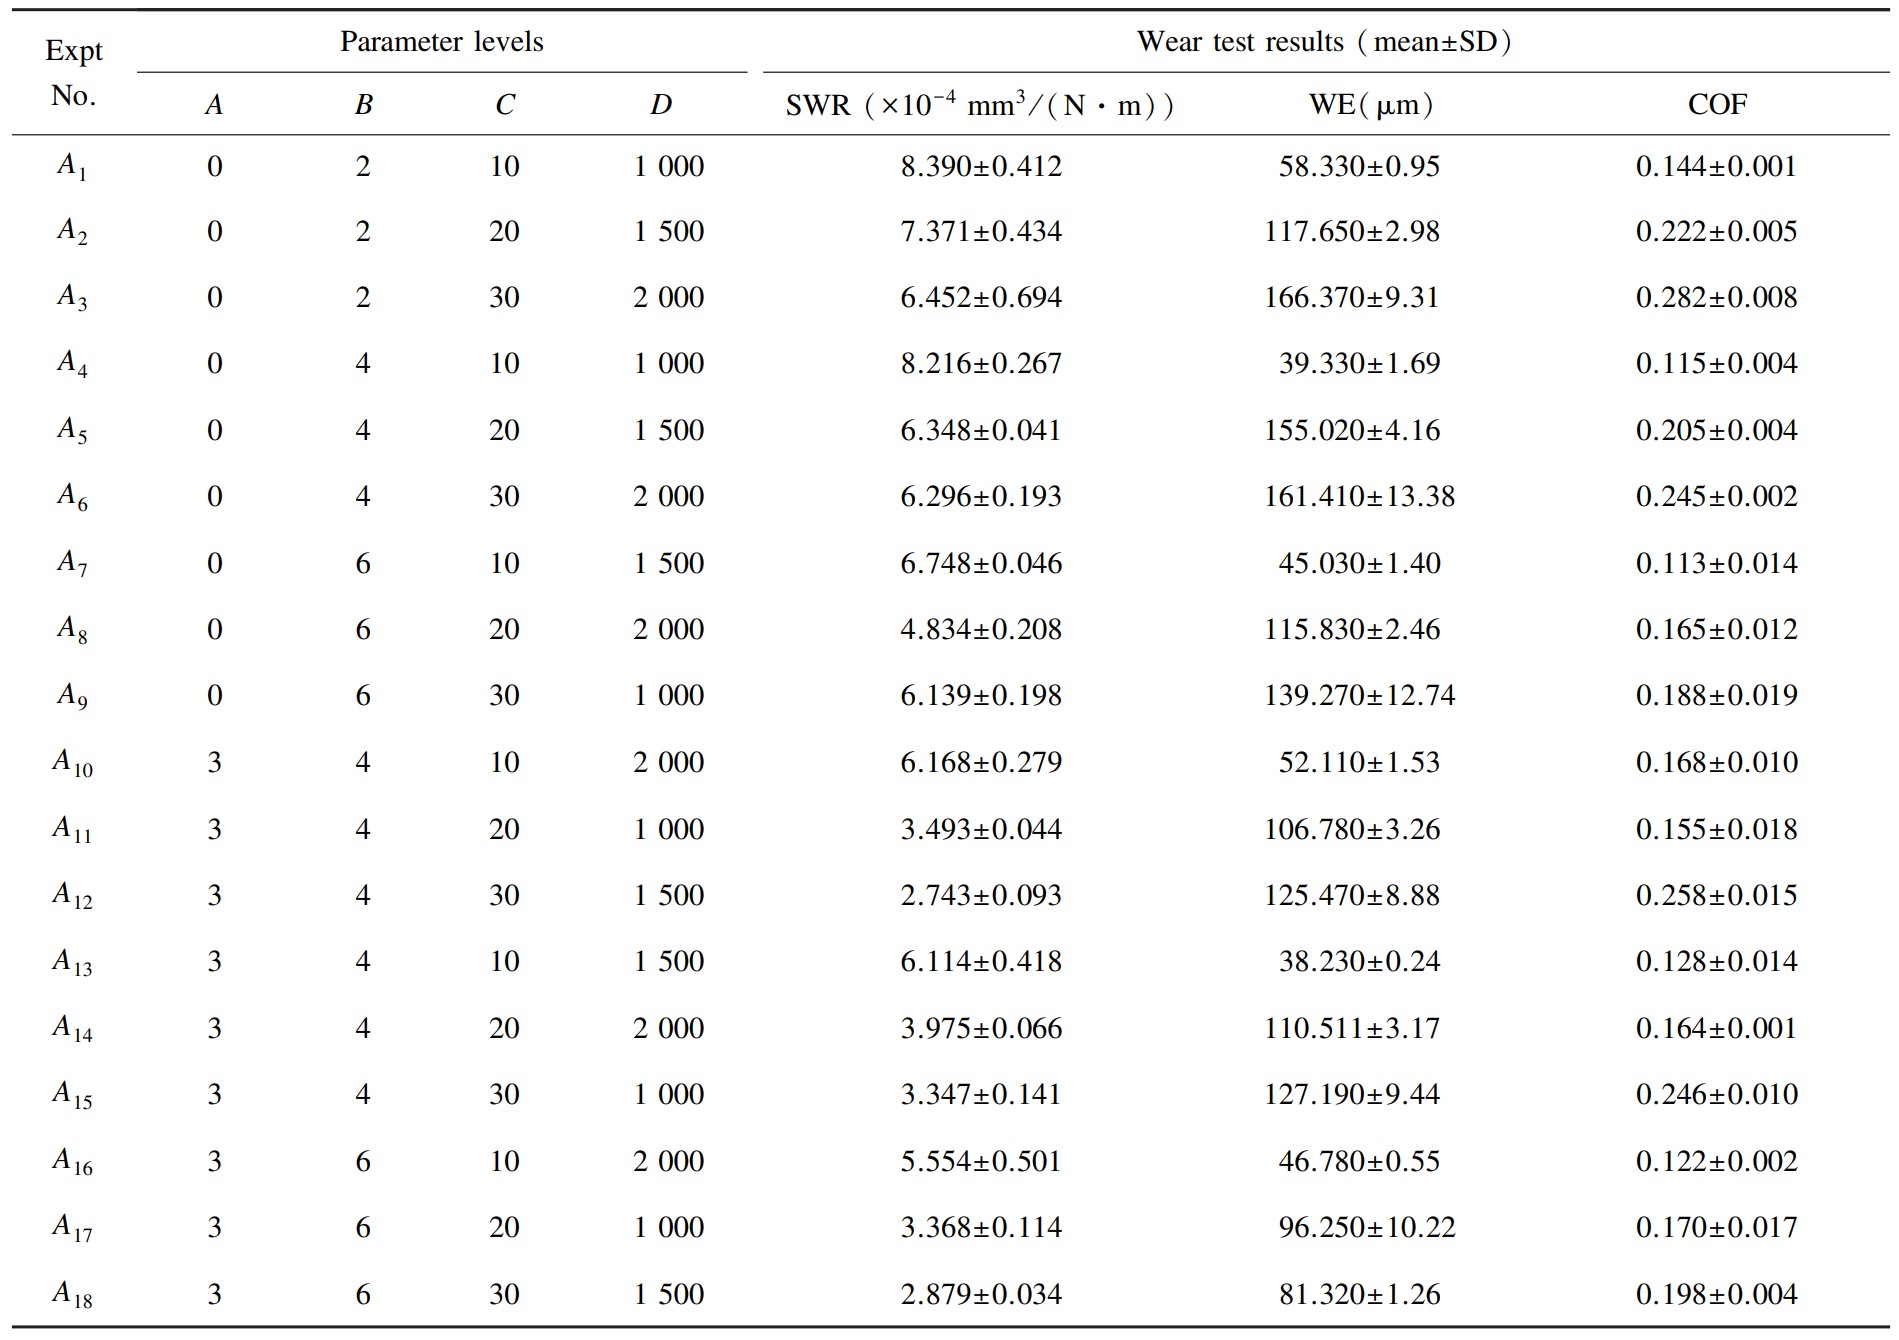
After a critical examination of the literature,ranges of Al2 O3(0-3%)and Gr(2%-6%)were considered cautiously for better wear performance of HMMCs[4,9,15,19,22]. A majority of the literature on wear studies revealed that AL and SD were dominant parameters[3,8,9,15]. Hence,AL and SD were considered. Based on the pilot experimentation,AL and SD were limited to 30 N and 2 000 m,respectively. Table 1 shows the wear parameters and their levels. Taguchi's L18(21 × 33)OA was chosen because the degrees of freedom(7)for these parameters are less than those of the selected OA. OAs are used to design experiments/ wear tests economically and make it possible to study every process parameter level with the fewest possible trials[35]. Table 2 indicates a combination of parameter levels and corresponding wear test results.
Table
1
Wear parameters and their levels

Table
2
L18(21 × 33)OA and wear test results of SWR,WE and COF(initial decision matrix)
1.2 Materials and Methods
AA7075/ Al2O3/ Gr HMMCs can be used for automobile parts such as brake discs,driveshafts,suspension parts,and aerospace parts such as landing gear components,transmission and fuselage components,and other applications. For the production of these composites,AA7075 was used as the matrix material and its chemical composition is:w(Zn)= 5.4%;w(Mn)= 0. 12%;w(Cu)= 1. 42%;w(Mg)= 2.42%;w(Cr)= 0.21%;w(Fe)= 0.42%;Al-balance. Where w denotes the mass fraction.Particulate reinforcements Al2 O3and Gr of sizes 40-50 μm were chosen to prepare the HMMCs. Al2O3was chosen as primary reinforcement due to its high hardness,wear resistance,stability at higher temperatures,relatively low cost and availability[1].Gr was chosen as secondary reinforcement due to its high melting point,self-lubricating property and high wear performance[1-2]. As a secondary reinforcement,Gr can significantly enhance tribological properties when combined with a harder primary phase Al2 O3.Gr makes the hybrid composite more resistant to wear,although the hardness increase is heavily dependent on the presence of Al2 O3 particles as the primary reinforcement. Further,multiple weight percentages allow systematic exploration of how reinforcement amount aids in optimizing the trade-offs among various criteria such as SWR,WE and COF[2].
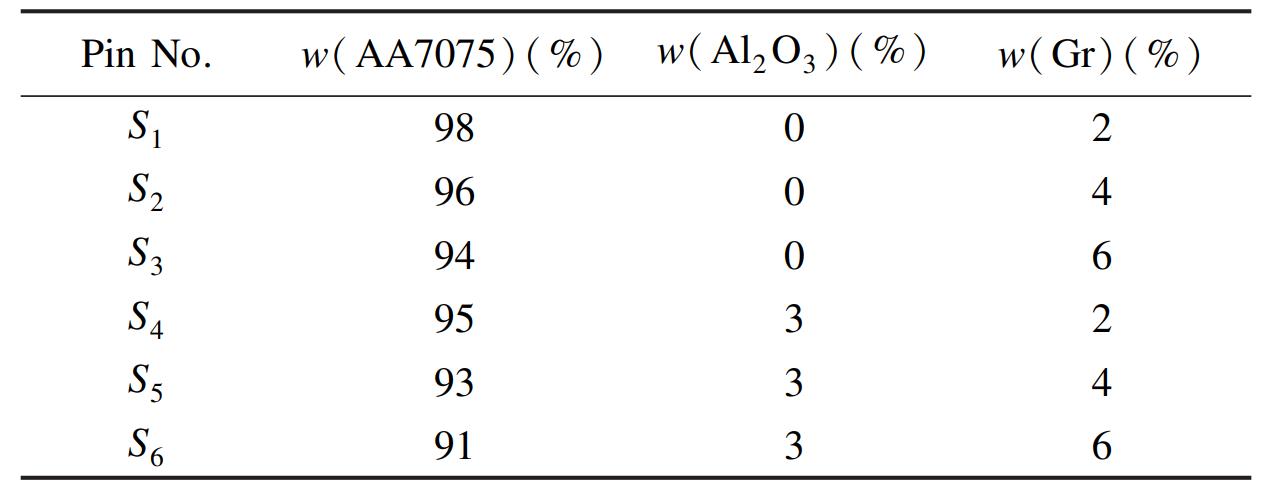
A simple and economical stir casting method[36]was preferred for the production of AA7075/ Al2 O3/Gr HMMCs. AA7075 blocks were charged in a crucible furnace and heated to~ 800 ℃ for 30 min.The alloy was stirred using a mechanical stirrer and afterwards preheated Al2O3(0 and 3%)and Gr(2%,4% and 6%)particles were added to the molten metal.The whole mixture was stirred continuously at300 r/ min for 15 min. Mg was added intermittently to the mixture for better wettability of the matrix and reinforcements. This mixture was poured into the mold cavity of size 12.0 cm × 5.5 cm × 1.8 cm and cooled down to room temperature. In the same way,six composite molds with different compositions(as shown in Table 3)were produced. Using CNC turning,six cylindrical pins with Φ8 mm and a height of 40 mm were machined from these composite molds as per ASTM-G99 standard,as shown in Fig.1(a).
Table
3
Compositions of six pins
For characterization,SEM images and EDAX spectra were taken for all six pins. Two samples of them,i.e.,S1and S4 are shown in Fig.1. It is evident from Figs.1(b)and 1(d)that Gr particles are fairly well dispersed in the matrix and seen as a dark gray phase. Fig.1(d)indicates that Al2O3 particles are seen as white particles and surrounded by the Gr phase.EDAX spectrums,i. e.,Figs. 1(c)and 1(e)show elements like aluminium(Al),Gr(C)and oxygen(O)with high-intensity peaks and other elements,such as Fe,Cu,Zn,Mg and Mn with low-intensity peaks. These graphs confirm the proper mixing of reinforcements and the matrix.
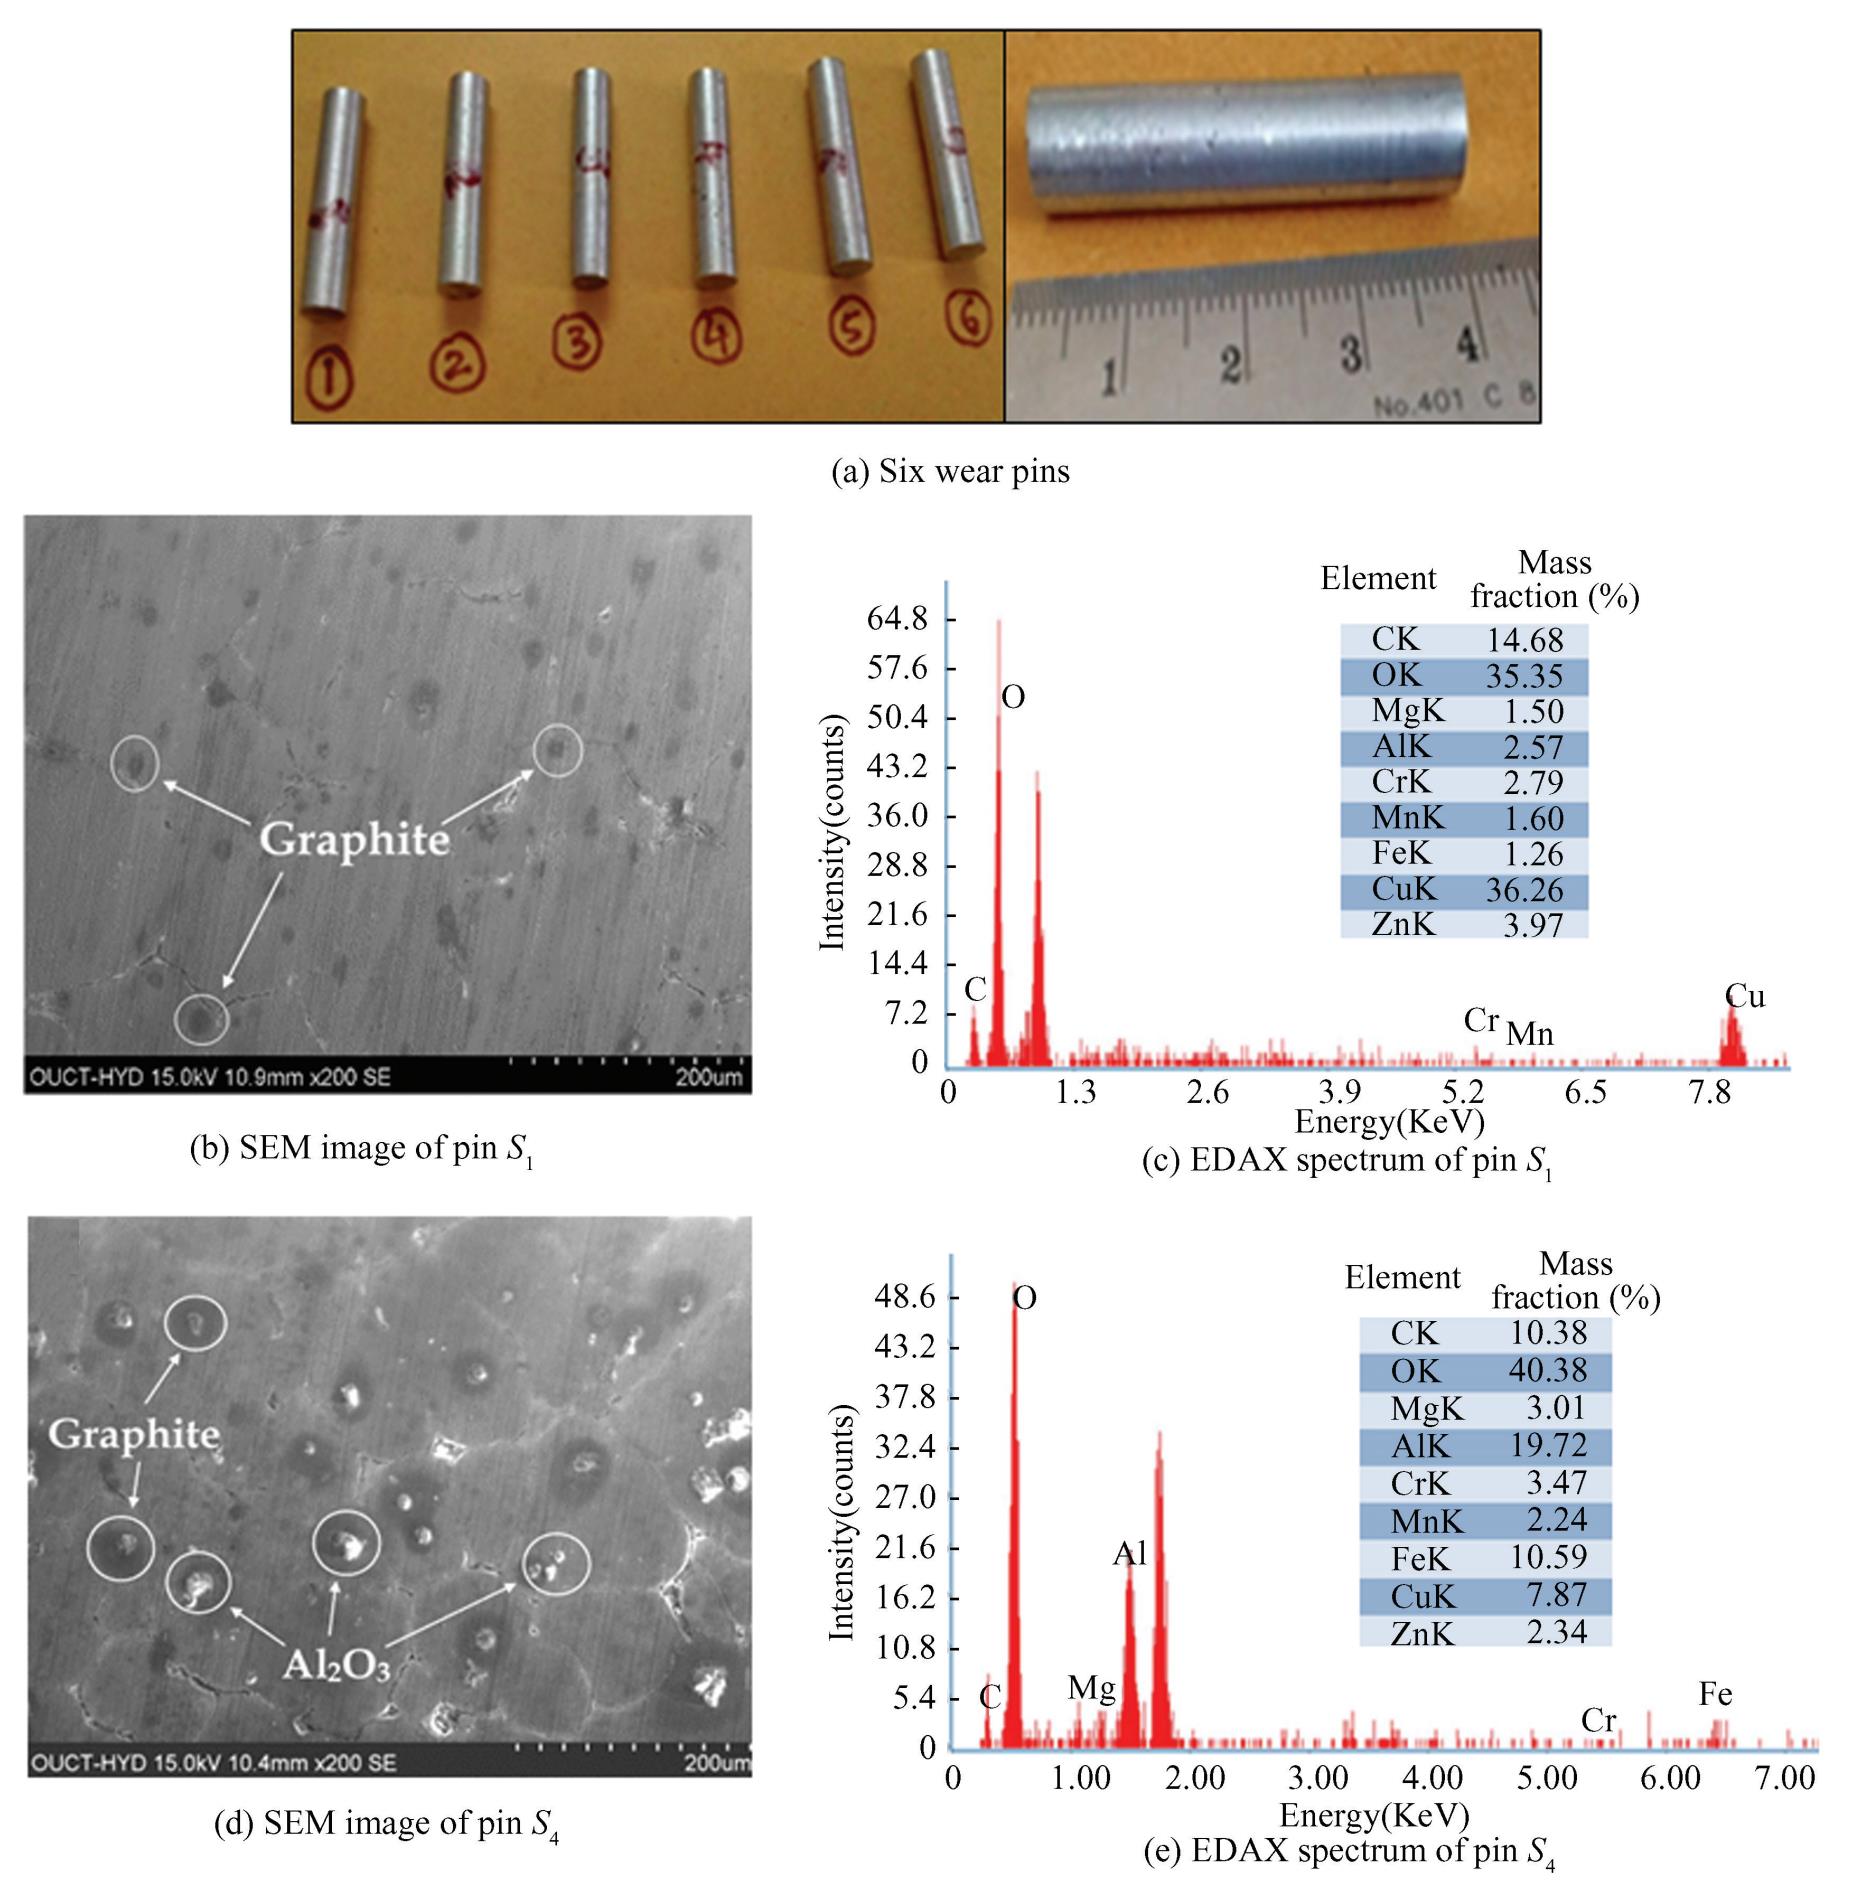
Fig.
1
Six wear pins,SEM images and EDAX spectrums of samples S1 and S4
1.3 Wear Tests and Measurements
It was important to conduct the wear tests carefully to get accurate results. However,the main objective of this study was to apply the BWM-TODIM approach for multi-criteria optimization of SWR,WE and COF. Each wear test was conducted twice on a pin-on-disc wear and friction tester(Make-Magnum Engineers,India),as shown in Fig.2. The pin and the counter disc(steel with 55HRc)were cleaned by acetone before each test. The load was applied when the pin was pressed against the counter disc rotating at a constant speed of 500 r/ min. The load was applied to the pins using a lever arm mechanism. As wear tests were being conducted,the experimental values of WE and COF were directly recorded by the data logger system attached to the machine and average values of WE and COF were obtained.
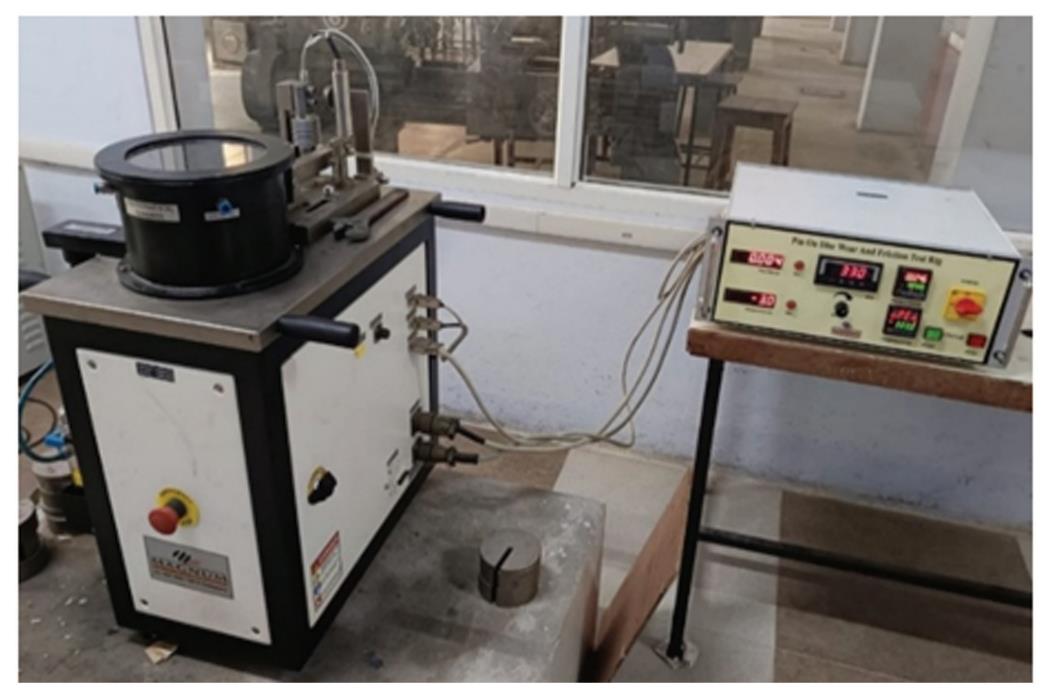
Fig.
2
Pin-on-disc wear and friction tester
The true density(ρtr)of each pin was determined using Archimedes' principle and a digital weighing balance with an accuracy of 0.001 mg.Then,SWR was calculated using Eqs.(1)-(4)[3]:
(1)
(2)
(3)
(4)
where m represents the mass of pin in air,m1is the mass of the same pin in distilled water;ρw is the density of distilled water(998 kg/ m3);ΔW is the weight loss of pin;W1is the weight of pin before wear test;W2 is the weight of pin after wear test;ΔV is the volume loss of test pin;RSW denotes the specific wear rate;LA denotes the applied load;DS denotes the sliding distance.
2 MCDM Methods:BWM and TODIM
BWM requires a smaller number of comparisons,i.e.,2j-3( j is the number of criteria)only with simple calculations. It adopts integers from 1-9 rather than fractions to decide weights. To estimate the weights from the pairwise comparisons,it involves solving a linear model. The decision-makers choose the best and worst criteria as references from a set of criteria for assessing the weights of each criterion. In the present study,the references were identified through expert-based pairwise scoring(consensus method)sheets for SWR,WE and COF. The following steps are involved in BWM[25]:
Step 1 Define a set of criteria.
Step 2 Define the best and worst criteria.
Step 3 Define the importance of the best criteria over other criteria ( AB j ) using a scale 1 - 9. The decision-maker determines a vector called Best-to-Other vector ( AB ) given by Eq.(5).
(5)
where aB1represents the importance of the best criteria over criteria 1 and so on,aBm is the importance of the best criteria over criteria m,ABB is the importance of the best criteria over itself.
Step 4 Define the importance of other criteria over the worst criteria(Aj W )using a scale 1-9. The decision-maker determines a vector called Other-to-Worst vector(AW)given by Eq.(6):
(6)
where a1W represents the importance of the criteria 1over the worst criteria and so on,amW is the importance of the criteria m over the worst criteria,AWW is the importance of the worst criteria over itself.
Step 5 Calculate optimal weight(w1,w2 and w3)for criteria j in such a way that it minimizes the maximum absolute differences and for j. Ref. [15] developed the linear BWM,as provided by Eq.(7),based on total weight set to 1 and no negativity constraints.
Minimize λ
(7)
where,λ represents the indicator of the consistency of the comparisons. The lower λ value represents higher consistency.
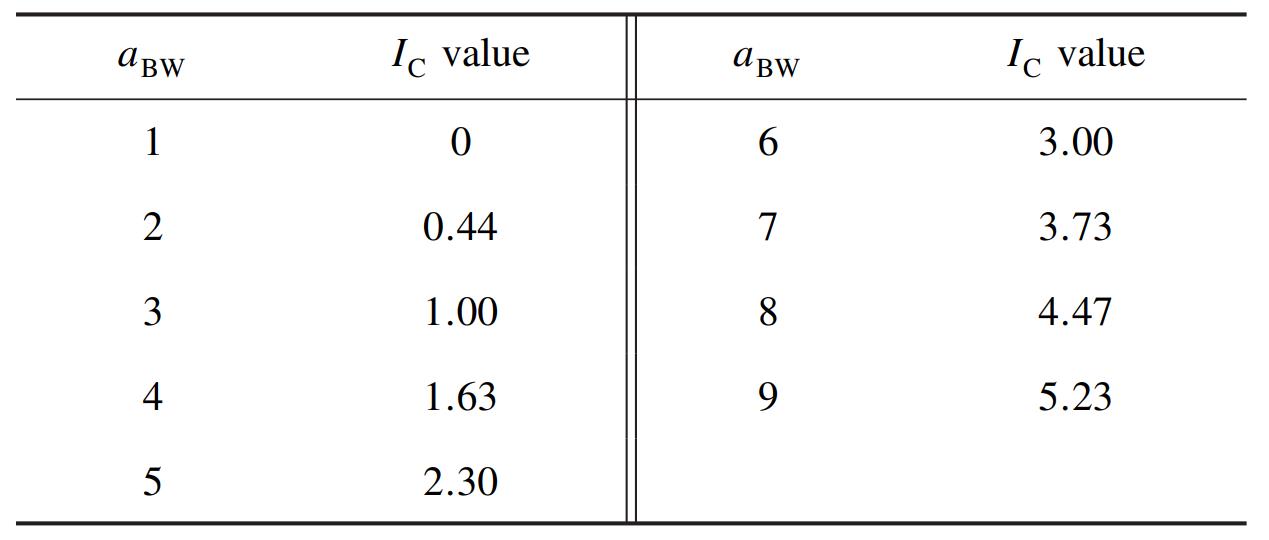
Step 6 Calculate the consistency ratio(RC)using Eq.(8). Here,the consistency index(IC)value can be selected from Table 4 based on the importance of the best criteria over the worst criteria(aBW). The comparison is considered more consistent and acceptable when the RC value is closer to zero.
(8)
Table
4
Consistency index value of aBW
TODIM is based on prospect theory and resembles its gain or loss function due to its similar shape functions. It deals with differences in a pair of alternatives with respect to criteria. Then,it sums up all measurements of gains and losses for each criterion. The main aim of TODIM is to measure the dominance degree of each alternative over others using prospect value functions. Also,it determines how much each alternative dominates the others on a partial and global basis before ranking the alternatives under consideration. The mathematical steps involved in TODIM are given below[33].
Step 1 Construct the decision matrix(D)with the number of alternatives(k)and the number of criteria(m)as indicated in Eq.(9):
(9)
where xik represents the value of ith alternative corresponding to jth criterion,and k= 1,2,···,n and j= 1,2,···,m.
Step 2 Normalize D by considering beneficial and non-beneficial criteria using Eqs.(10)and(11)respectively. In the present study,all criteria are non-beneficial.
(10)
(11)
where Pik represents the normalized value that lies between 0-1.
Step 3 Derive the criteria weights(wj)and calculate the relative weight(wcr)of criteria(wi)using reference criteria weight(wr)and Eq.(12). In this study,SWR is the reference criteria with the highest weight of 0.583 3.
(12)
Step 4 Calculate the dominance degree(δ(Aij,Akj))of the alternative Ai over the alternative Ak employing Eq.(13):
(13)
where,Aij reprensents the ith alternative of jth criteria,Akj is the kth alternative of jth criteria.
In the above equation,Φ(Aij,Akj)concerning criterion j is evaluated using Eq.(14):
(14)
where(Pij-Pkj)> 0 and(Pij-Pkj)< 0 specify the gain and loss of the ith alternative over the kth alternative,respectively. In prospect theory,different shapes of the value function may be obtained with different values of θ in the negative quadrant. In this study,θ= 1 is considered[33,37].
Step 5 Determine the overall dominance degree(ψi )of the alternative Ai using Eq.(15):
(15)
Step 6 Rank the alternatives according to descending ψi values. The best and worst alternatives correspond to the maximum and minimum values ofψi ,respectively.
The flowchart of the proposed BWM-TODIM methodology for multi-criteria optimization is shown in Fig.3.
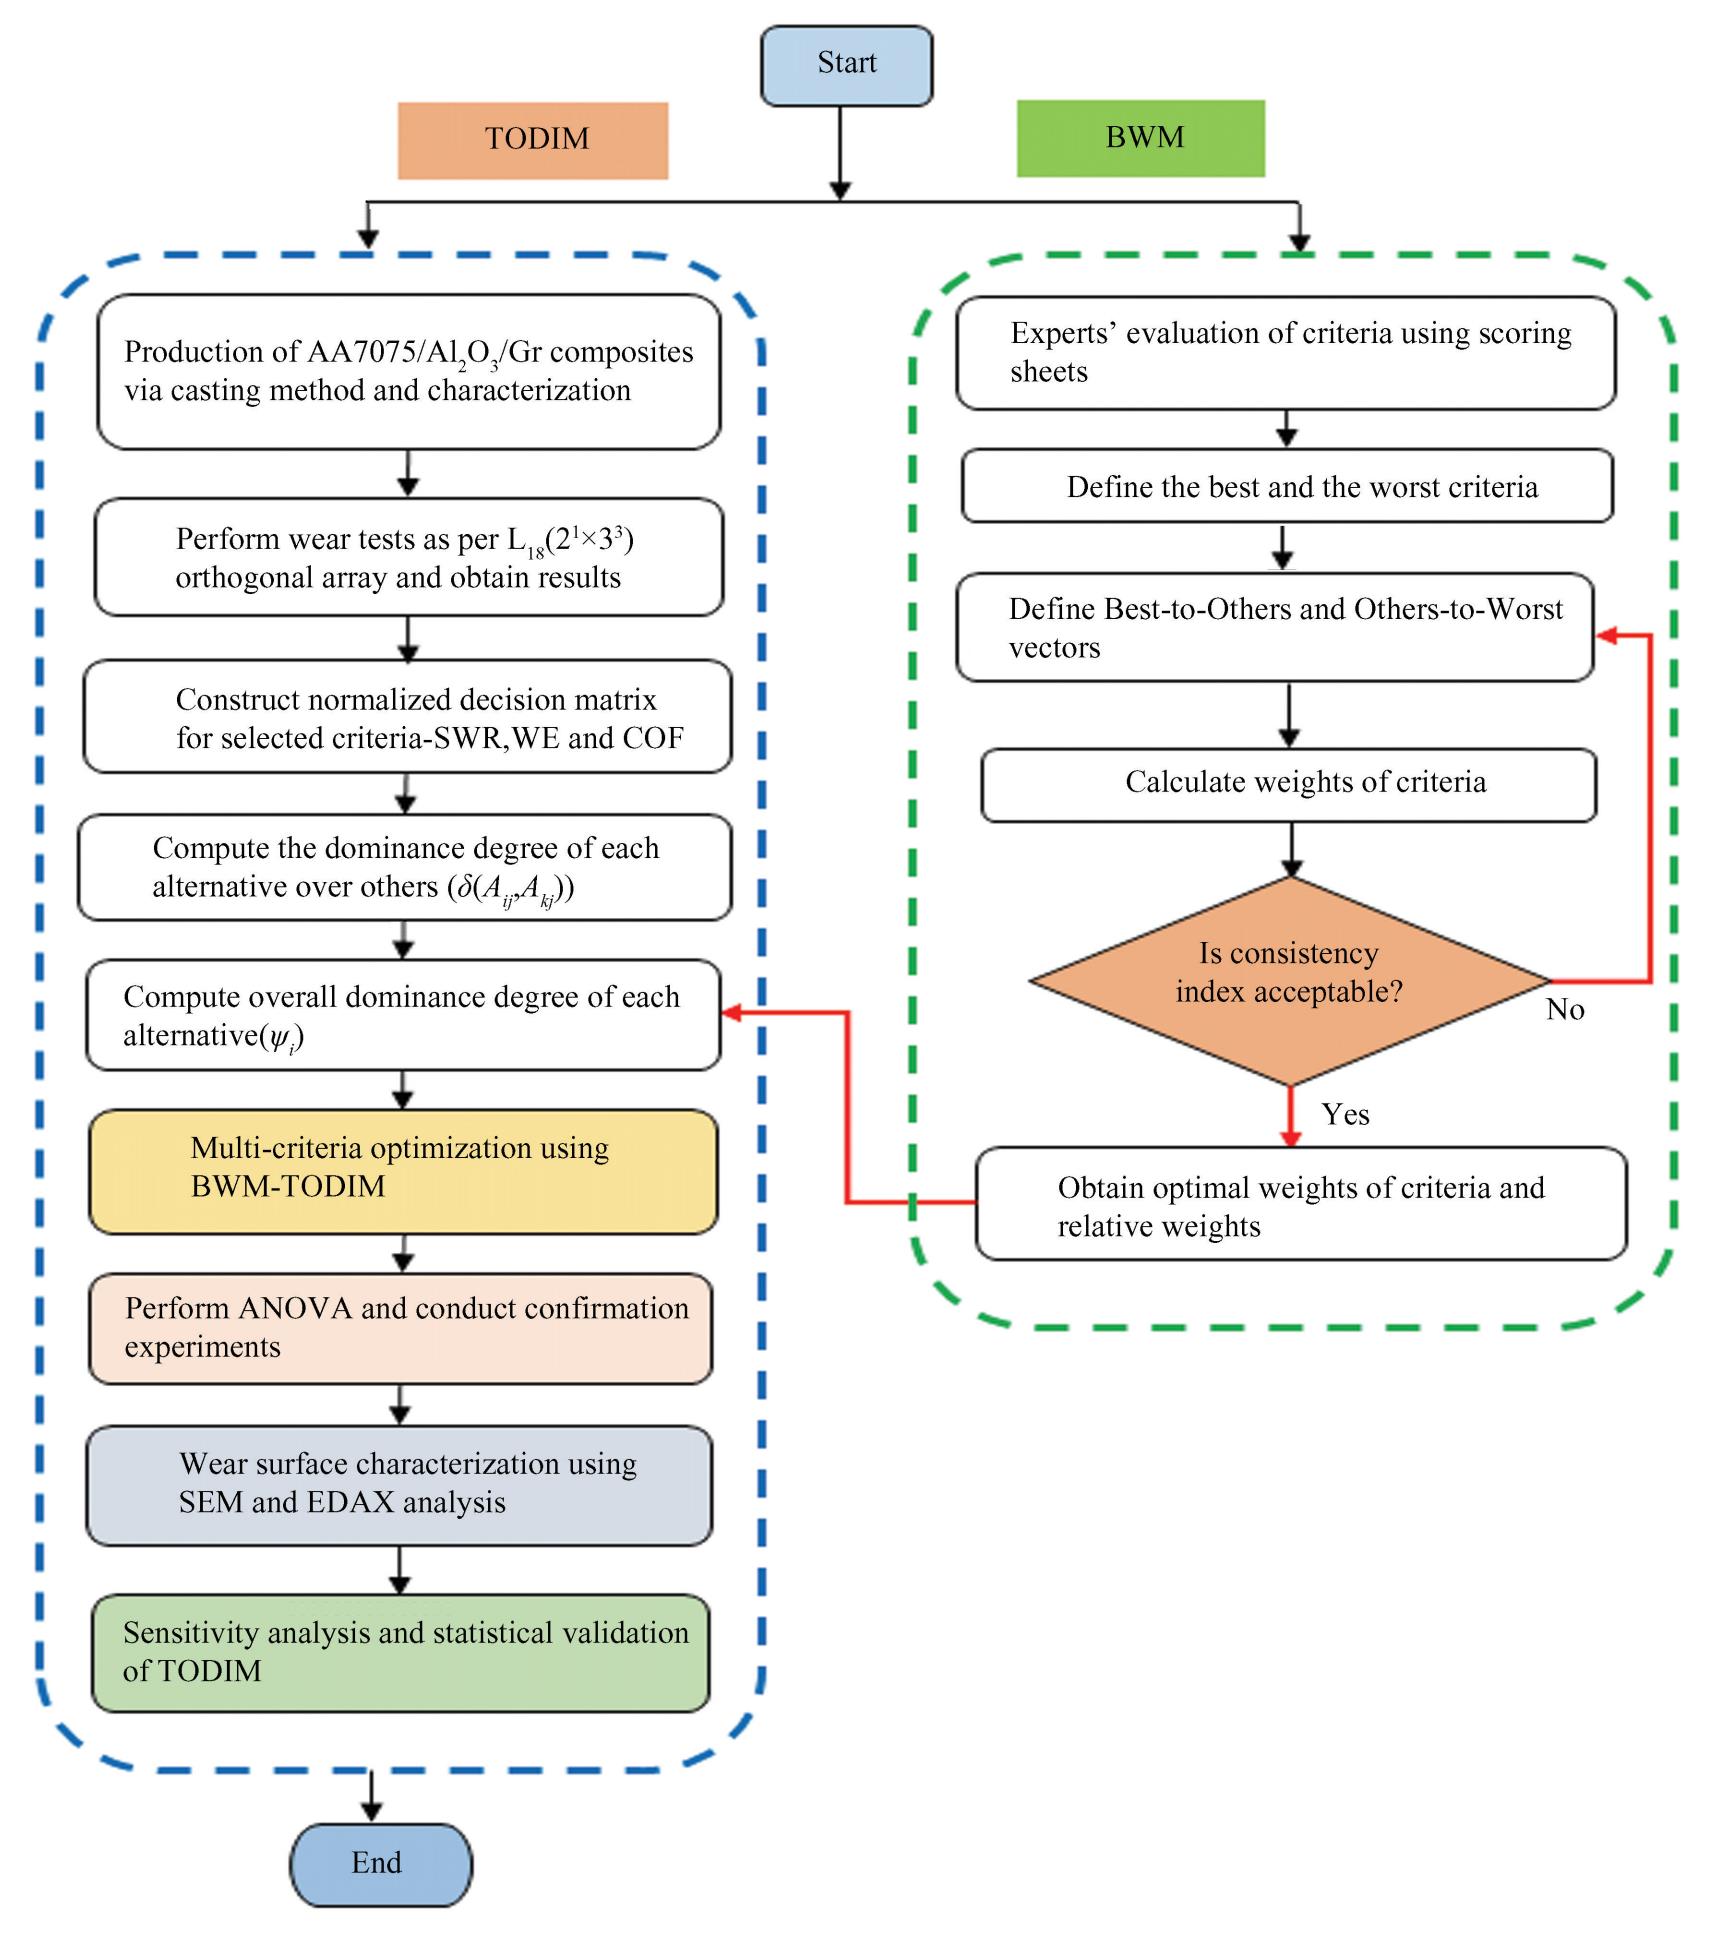
Fig.
3
A flowchart of BWM-TODIM methodology for multi-criteria optimization
3 Results and Discussion
This section presents the results of applying BWM to determine weights of criteria,followed by TODIM to rank the alternatives under consideration and identify the best and worst alternatives.Subsequently,ANOVA results are discussed to identify the significant process parameters and to complement the results of TODIM. SEM and EDAX analyses of worn surfaces corresponding to the best and the worst surfaces are done as microstructural evidence of the optimized results provided by TODIM.
3.1 Multi-Criteria Optimization Using BWM-TODIM
In this study,a set of criteria,i.e.,SWR,WE and COF was considered. As per Step 2 in Section 2,expert-based pairwise scoring sheets were evaluated by three experts with more than ten years of experience each,i. e.,an academician,a design engineer and a process engineer. The sheet included aspects such as correlation with service life,comparability across tests,decision usefulness,standardization and acceptance,and sensitivity of these criteria in the scoring sheet. Based on these scores,SWR and WE emerged as the best and worst criteria,respectively. Later,Best-to-Others and Others-to-Worst vectors were constructed as shown in Table 5. The optimal weights were obtained using BWM Excel Solver as 0.583 3,0.111 1 and 0.305 6for SWR,WE and COF,respectively,as shown in Table 6. The consistency ratio(RC= 0.05)confirmed acceptable judgment reliability. The weights were used as inputs to TODIM. A decision matrix of m criteria and n alternatives(Table 2)was normalized using Eq.(11). The ψi value for each alternative was then calculated using Eqs.(13)-(15)and ranked in descending order(as shown in Table 7). The results indicated A16(A2 B3 C1 D3)as the best alternative(rank= 1)with desirable values(SWR:5. 554 ×10-4 mm3/(N·m);WE:46. 78 μm;COF:0. 122),while A3(A1 B1 C3 D3)as the worst(rank= 18),showing undesirable values(SWR:6. 452 ×10-4 mm3/(N·m);WE:166.370 μm;COF:0.282).
Table
5
Best-to-Other and Other-to-Worst vectors

Table
6
Optimal weights and relative weights

Table
7
Φ(Aij,Akj),δ(Aij,Akj),ψi values and ranking of alternatives
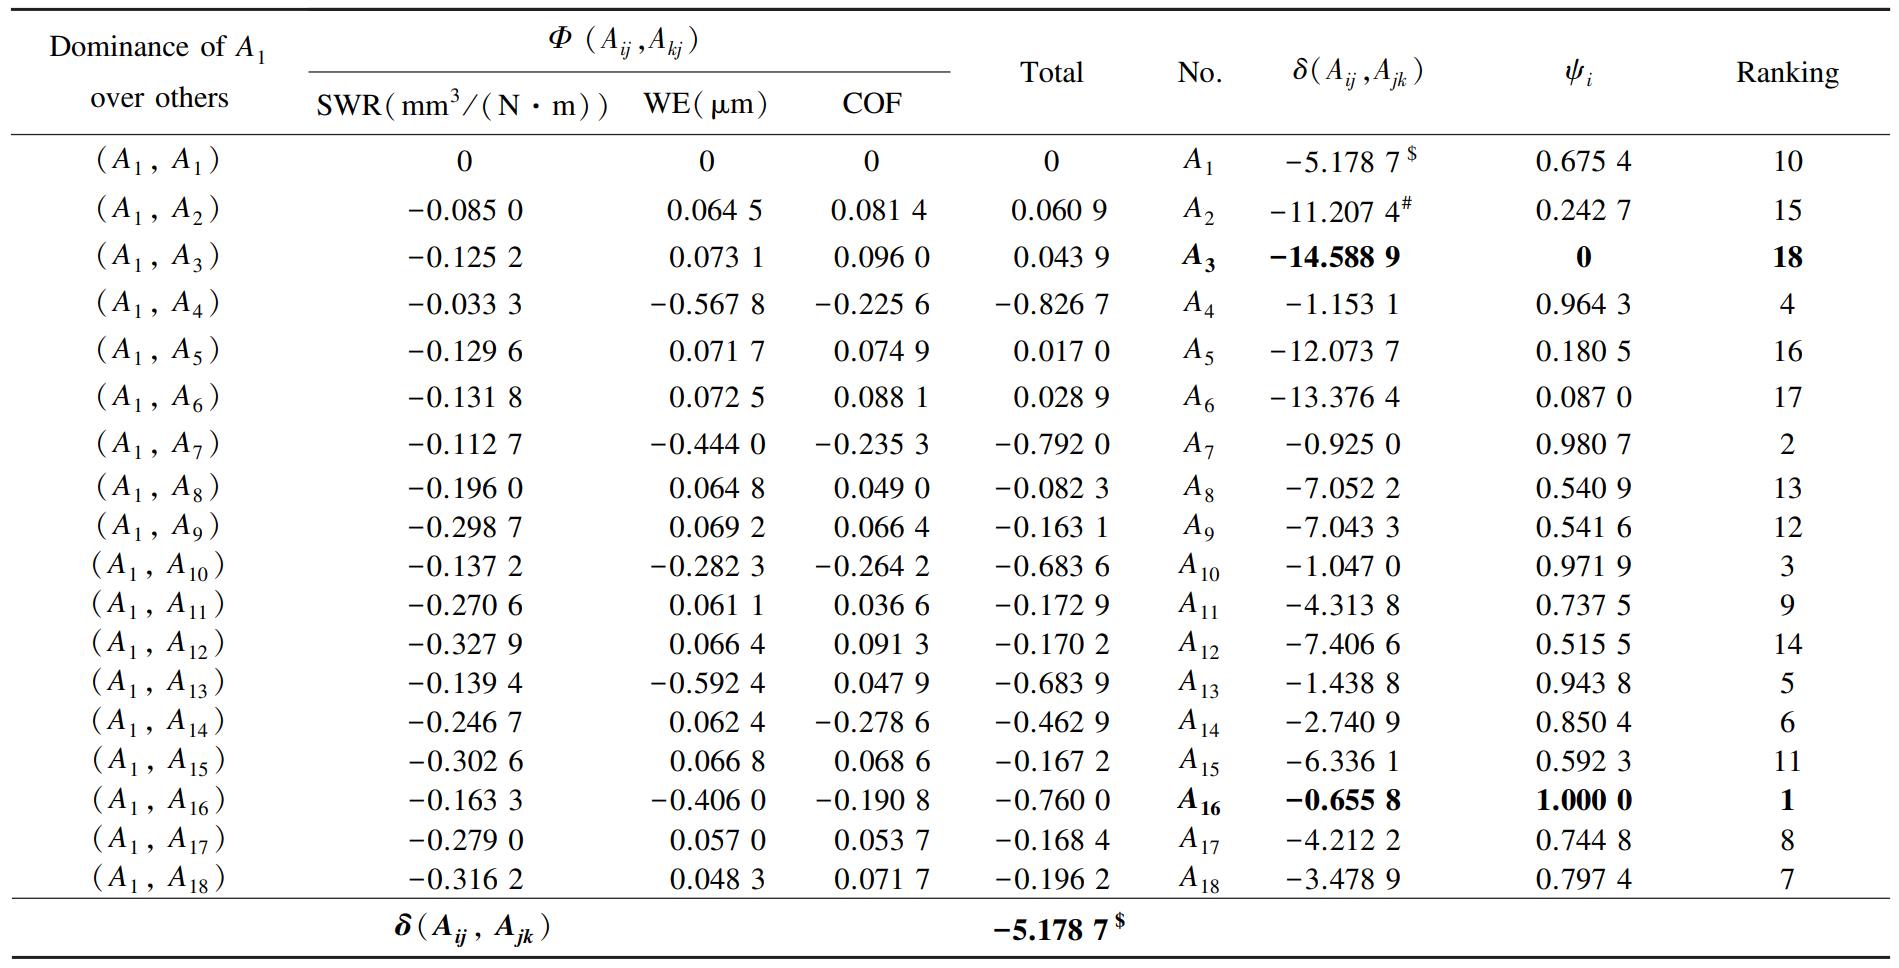
Note:The symbol ‘$ ’ represents the dominance of A1 over other alternatives;The symbol ‘#’ represents the dominance of A2 over other alternatives and so on.
3.2 ANOVA of ψi and Confirmation Tests
While TODIM provides a ranking of alternatives,ANOVA was employed to statistically validate the significance of process parameters influencing ψi . The ANOVA results(as shown in Table 8),obtained using Minitab 19 software,revealed AL,Al2O3and Gr as highly significant(p< 0. 05),with AL contributing the most(46.00%),followed by Al2O3(27.22%)and Gr(10.51%). As shown in Fig. 4,ψi increased with Al2O3and Gr but decreased with AL and SD. The optimum levels were identified as A2B3C1D1. Although these levels fall outside the L18OA,TODIM predicted the best alternative as A16(A2B3C1D3),which lies within the OA. Since SD was insignificant,its effect on ψi was negligible. Overall,the optimal parameters derived from ANOVA and TODIM are equivalent,confirming the robustness of the TODIM findings.
Table
8
ANOVA of ψi
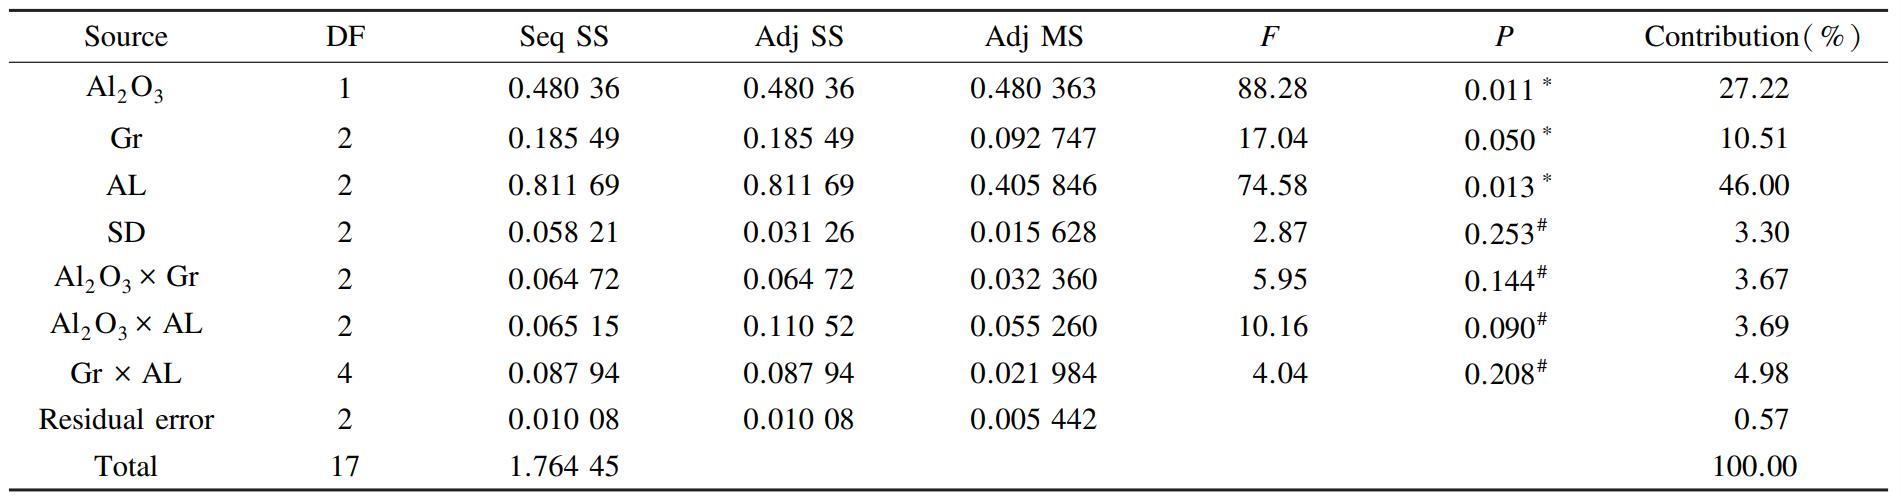
Note:The symbols ‘∗’ and ‘#’ represent significant and insignificant parameters at 5% confidence level;Seq SS represents the sequential sum of squares;Adj SS is adjusted sum of squares;F is the Fischer ratio;P is the probability value;R2= 0.993 8 and R2 Adj. equals 0.951 4
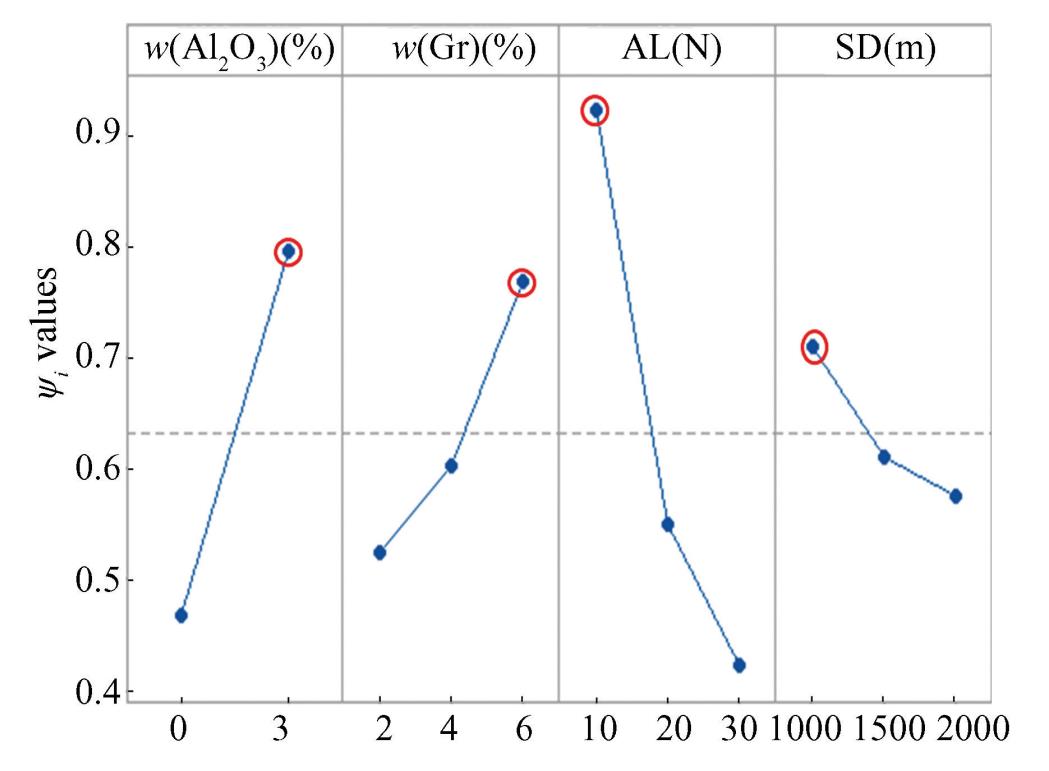
Fig.
4
Main effects plot of ψi
For comparison and confirmation of results,tests were conducted twice at the optimum parameter levels and average values were used for analysis. The predicted(ψi )pred values were calculated based on the additive model[9]for all terms(as shown in Table 8)using Eq.(16). The predicted(ψi )pred was close to that of experimental value,as shown in Table 9.
(16)
here(ψi )m represents the overall mean of ψi values. is the mean of ψi at optimum parameter levels(Table 7).
Table
9
Predicted and experimental values of ψi at optimum parameter levels

Further,the comparisons of SWR,WE and COF were made at optimum and commonly used wear parameter levels,as shown in Table 10. Commonly used parameters A1 B1 C1 D1 were considered in the present study. It can be seen that percentage improvements in SWR,WE and COF at optimal parameters are 41.10%,5.98% and 19.44%,respectively.
Table
10
Results of confirmation experiments

3.3 Wear Surface Characterization Using SEM and EDAX Analyses
SEM and EDAX analyses were carried out to substantiate the wear parameters obtained from TODIM results. It can be seen from Fig. 5 that there exists predominant abrasive wear due to the presence of grooves on both surfaces,but their degree of occurrence is different. The worn surface of the best alternative A16exhibited fine grooves,minimal debris,and negligible delamination,attributed to Al2O3load-bearing particles and a thick tribo-layer at 6% mass fraction of Gr. In contrast,A3showed deep grooves,heavy debris,and severe delamination due to ploughing action and the absence of load-bearing particles. Consequently,A16 demonstrated lower SWR,WE,and COF than A3. Both EDAX spectra(Figs. 5(b)&(d))revealed the presence of C that corroborates the formation of the Gr tribo-layer,which accounts for the less wear. O contents of 33. 04%(A16)and 48. 93%(A3)confirm the formation of oxide layers and oxidative wear. Also,traces of Mg,Al,Cr,Mn,Fe,Cu and Zn,alloying elements of AA7075,were observed.
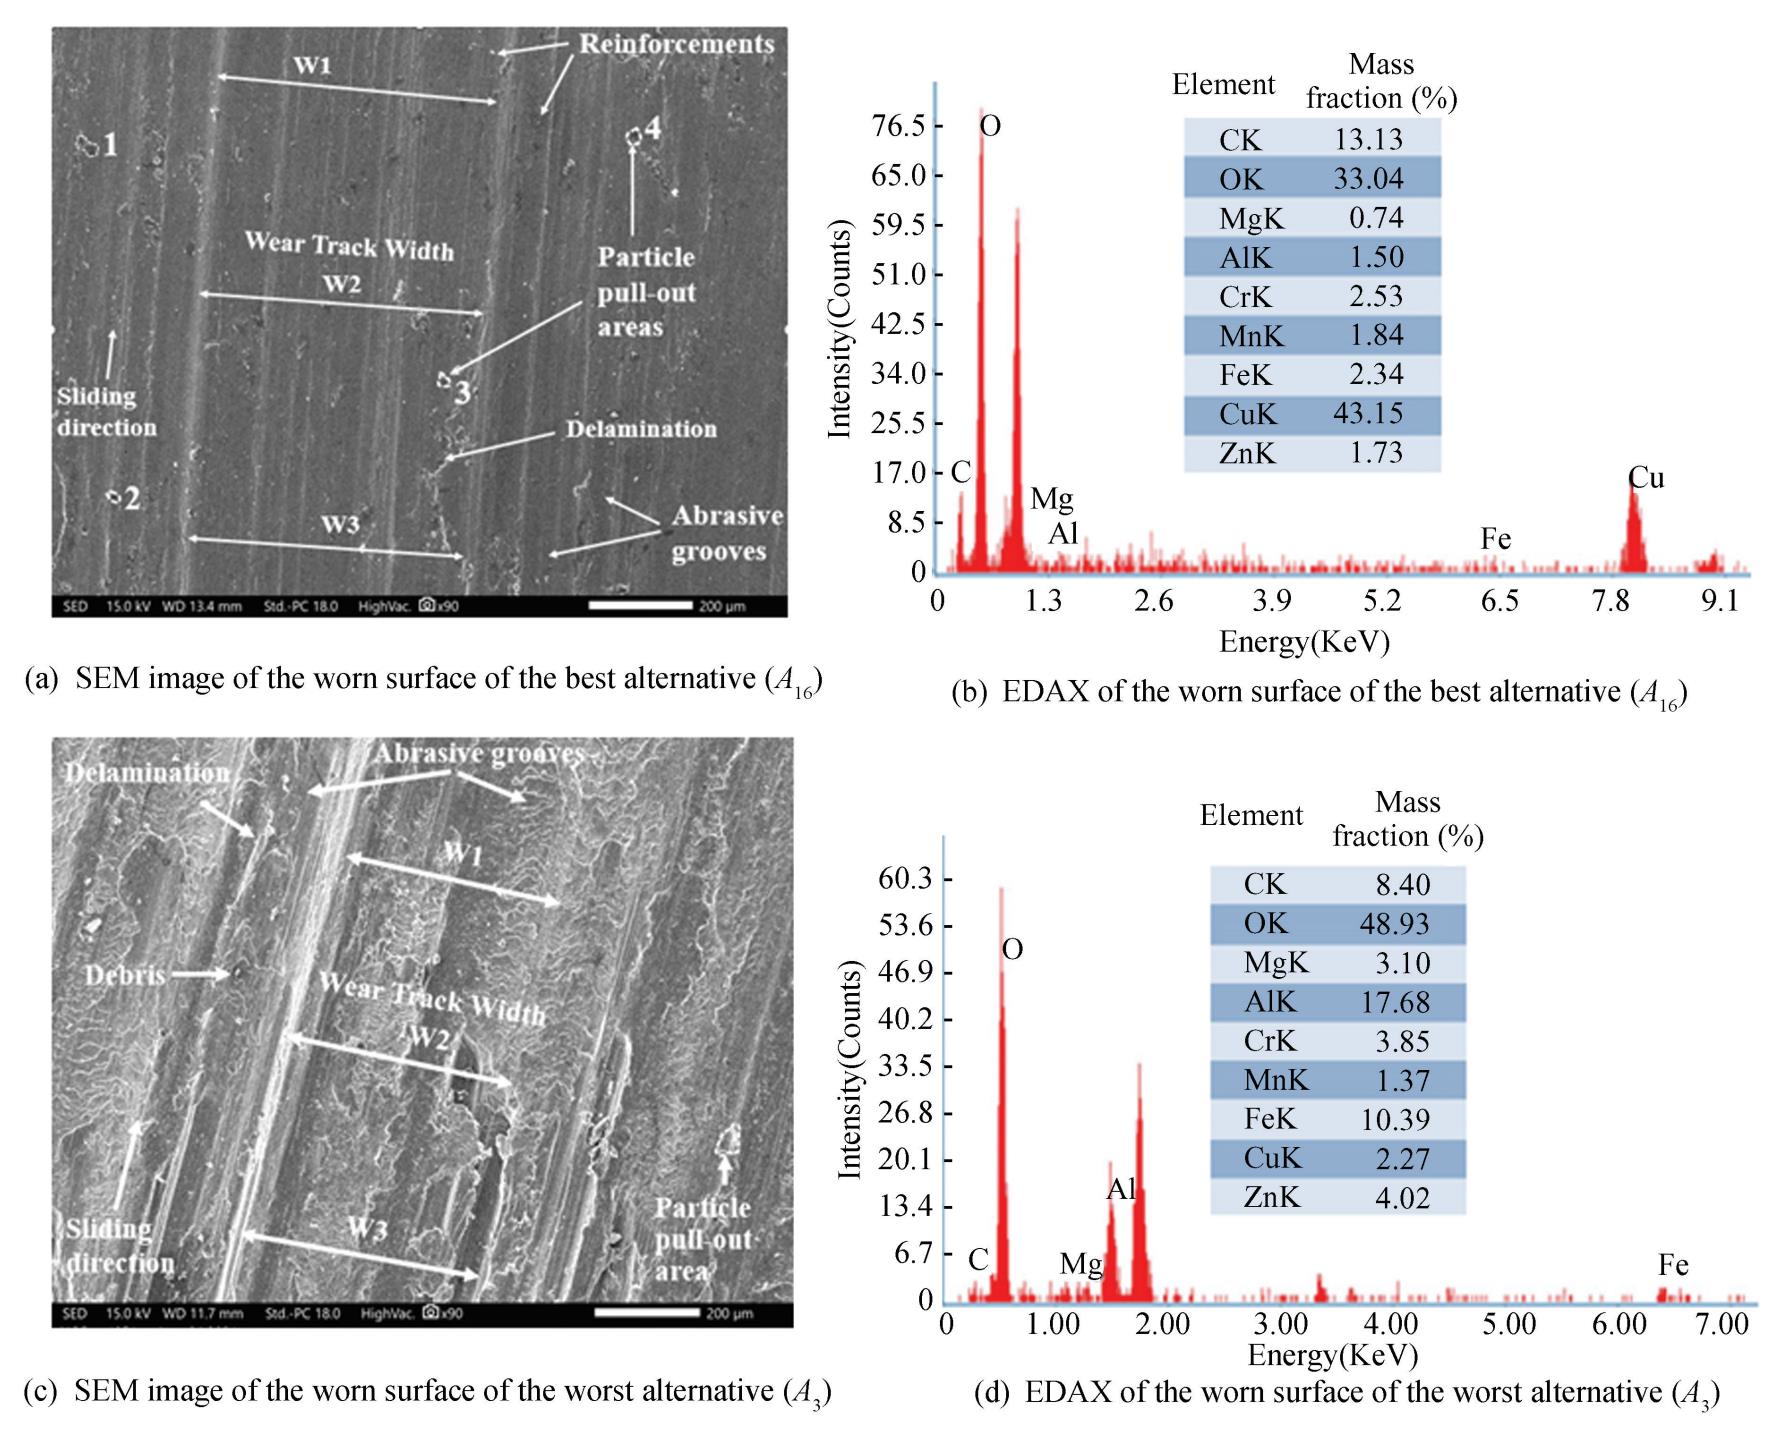
Fig.
5
SEM images and EDAX spectrums of worn surfaces
Quantitative analysis of worn surfaces considering average wear track widths(W1 ,W2 and W3),groove density,and particle pull-out areas(1-4)in Figs. 5(a)&(c)was done using Image-J software. Table 11shows that A16exhibited a wider but shallower track(815.6 μm)than A3(579.8 μm),attributed to plastic deformation and micro-plugging at low load. In contrast,A3 displayed narrower yet deeper tracks,indicating greater material loss. Groove density was slightly higher for A16(0.075 grooves/ μm)than for A3(0.066 grooves/ μm),suggesting finer groove formation. Pull-out area was also larger in A16(506.2 μm2)compared to A3(245.8 μm2). It may be due to the severe wear on the A3surface,which promotes material flow over the surface with fewer visible pull-out areas. Overall,the analysis confirms that A16 had less material loss than A3,indicating superior wear performance. Thus,SEM and EDAX results align with the optimized parameters suggested by the BWM-TODIM method.
Table
11
Quantitative analysis of worn surfaces

4 Sensitivity Analysis and Statistical Validation of TODIM
Sensitivity analysis is important for the validation of the robustness and reliability of a chosen MCDM method[37]. This section presents four methods,i. e.,modification of criteria weights,comparison with other MCDM methods,variation of θ values,and comparison with CDF to asses the robustness of TODIM. In addition,a statistical validation test is also done using bootstrapping to asses the significance of the difference in rankings obtained by TODIM.
4.1 Effect of Modification of Criteria Weight on TODIM Ranking
In this section,the criteria weights were modified using four modifications( M1- M4)as shown in Table 12. In M1-M3,a strong weight(0.5)was assigned to one criterion,with the remainder equally distributed. While in M4,equal weights(0.33)were used[33,38]. The TODIM procedure was repeated under each modification,and the resulting rankings are shown in Fig. 6. It was found that A16was consistently identified as the best and A3as the worst alternative. Although minor shifts in middle rankings were observed,the overall outcome remained unchanged,confirming the robustness of TODIM against weight modifications.
Table
12
Modifications of criteria weights
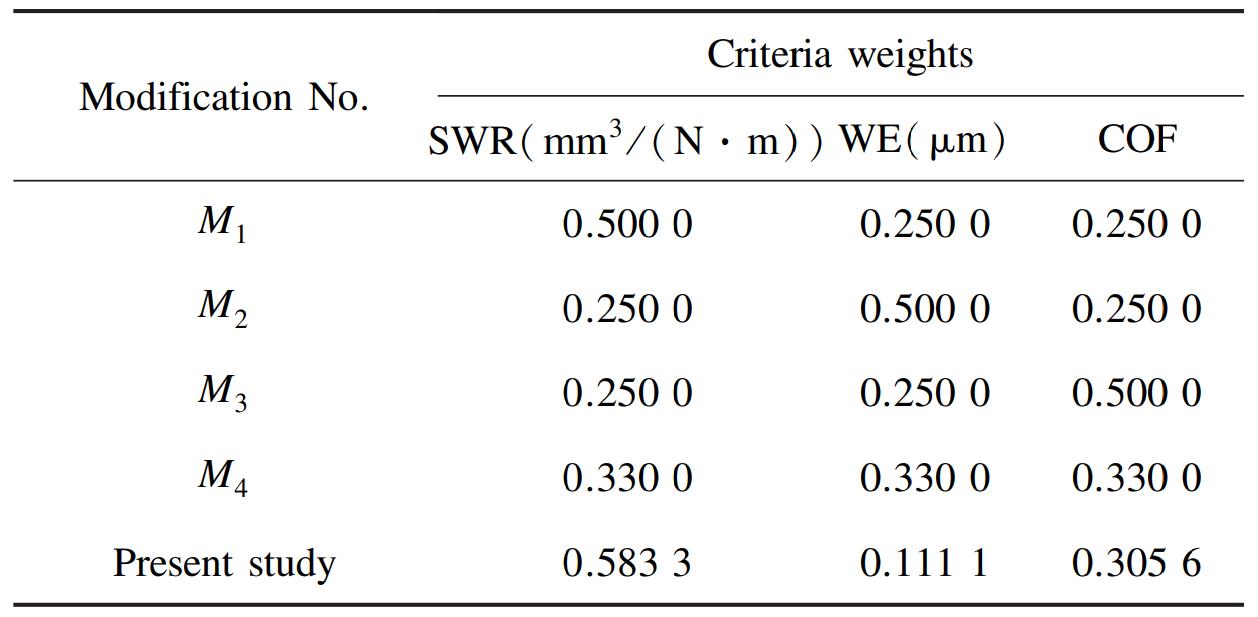
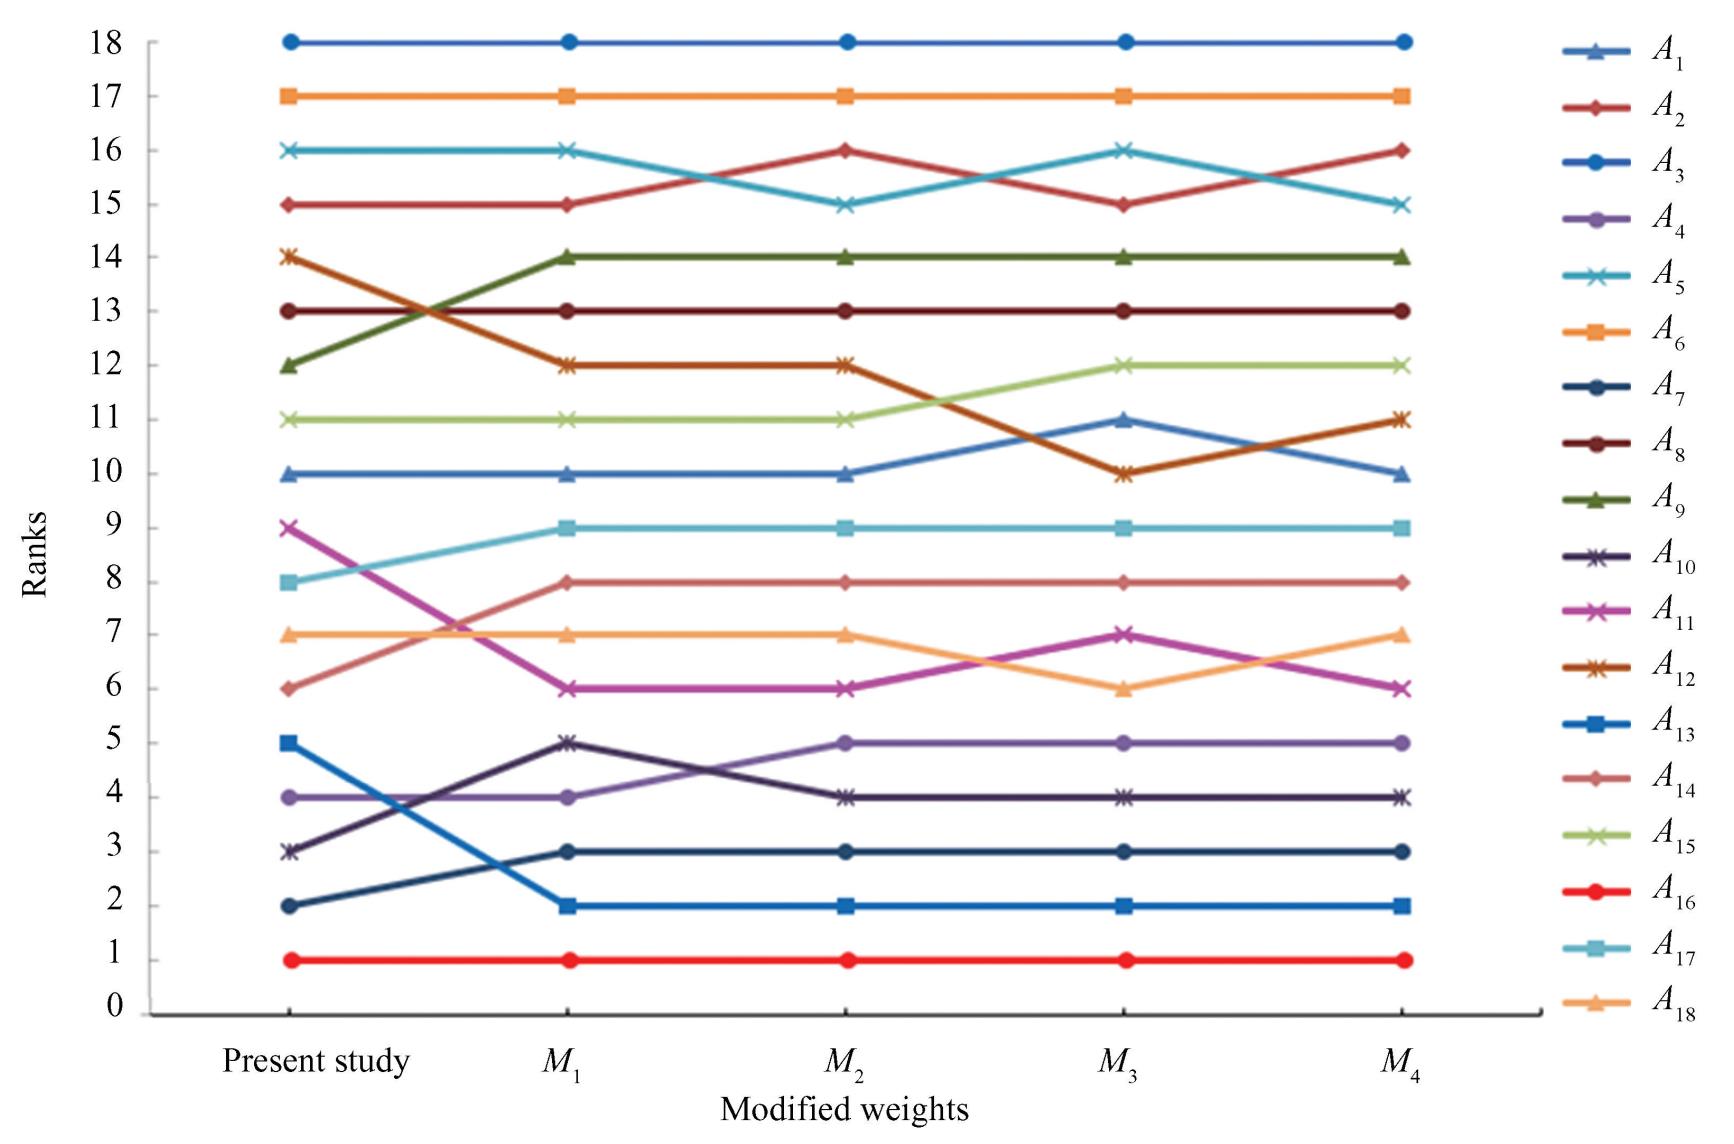
Fig.
6
Effect of modified criteria weight on the ranking of alternatives
4.2 Effect of MCDM on Ranking
In this analysis,TODIM was compared with six different popular MCDM like simple additive weighing(SAW)[39],multi-criteria optimization on the basis of ratio analysis(MOORA)[40],evaluation based on distance from average solution(EDAS)[41],GRA[42],VIKOR[43]and technique for order preference by similarity to ideal solution(TOPSIS)[44]for rankings of alternatives with BWM weights and the corresponding rankings are shown in Fig. 7. It revealed that A16evolved as the best alternative(rank= 1),whereas A3as the worst alternative(rank= 18)for all methods except GRA.Major shifts in the rankings of other alternatives of TODIM were observed. This may be due to the fact that TODIM uniquely incorporates gains and losses which are treated as non-linear functions,whereas gains and losses of other MCDM methods are treated as linear/ distance-based functions. In addition,shifts may also happen due to differences in assumptions,variations in procedures and computational steps of MCDM methods,and different normalization methods[37].
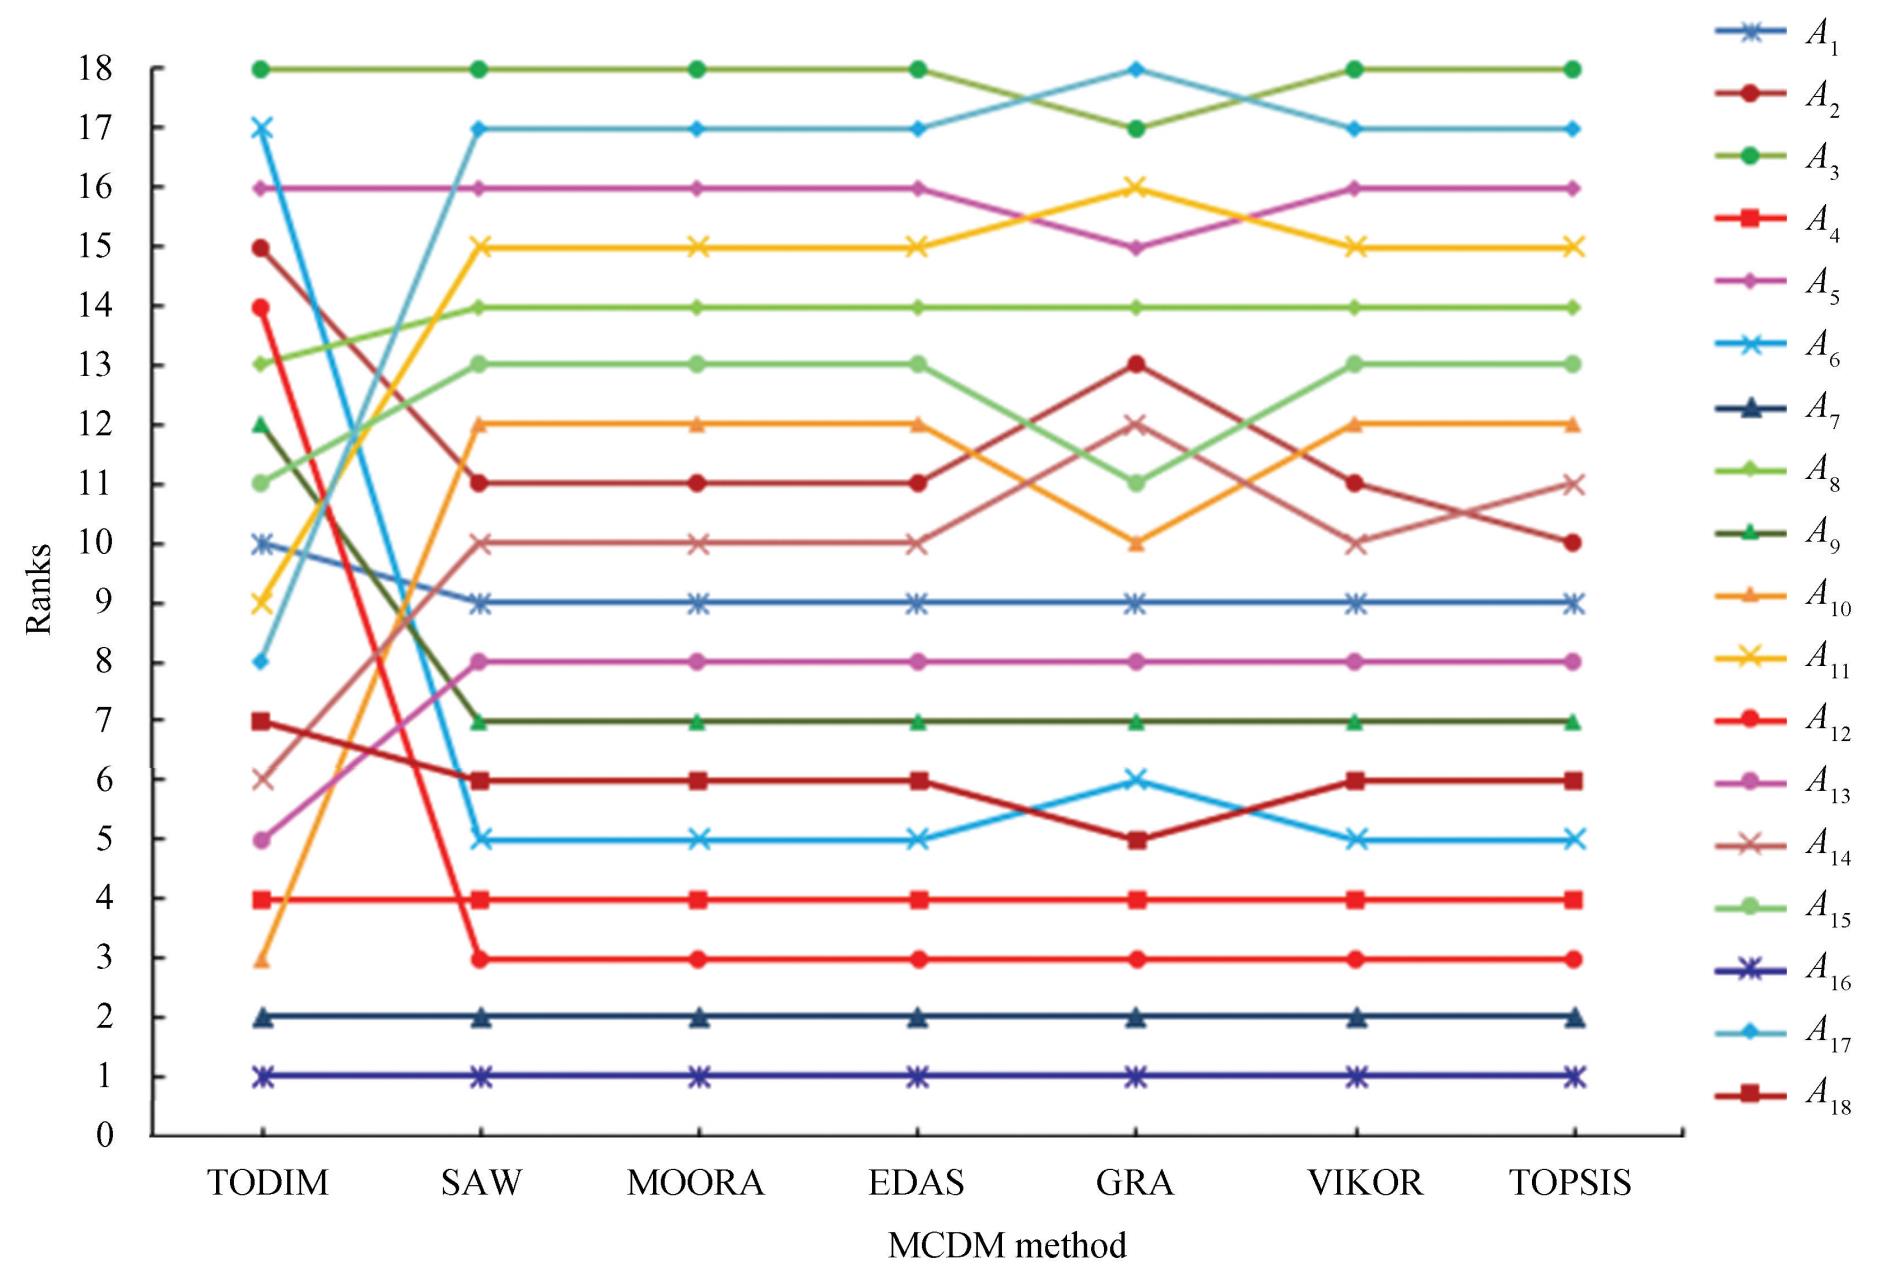
Fig.
7
Effect of MCDM on ranking of alternatives
The Spearman's correlation coefficient(Rs)is used to find out the deviation of one method from the other. It establishes the degree and direction of the relationship between the variables that are ranked.User's guide to correlation coefficients[45]suggests that a correlation is considered as ‘strong’ with accepted values> ± 0. 7,‘moderate’ with accepted values~ ± 0. 40-0. 69 and ‘weak‘ with accepted values<±0.40. Rs is calculated using Eq.(17)and ranges between-1 and+1.
(17)
here,n represents the number of alternatives,di is the difference in rank of ith alternative of two MCDM methods.
The heatmap of correlation coefficients(as shown in Fig. 8)shows that TODIM exhibits strong correlation with VIKOR(Rs= 0. 72)[45],moderate correlation(Rs ≈ 0. 40-0. 50)with other methods,and weak correlation with TOPSIS(Rs= 0.29). This indicates consistency between TODIM and VIKOR,while deviations occur with TOPSIS. Similar observations were reported in earlier studies[37-39]. As noted in Ref. [46],if the top-ranked alternatives remain stable despite changes in middle and low-ranked positions,the method can be considered robust. Accordingly,TODIM is robust to these methods,as the top two alternatives(A16and A7)remained unchanged.
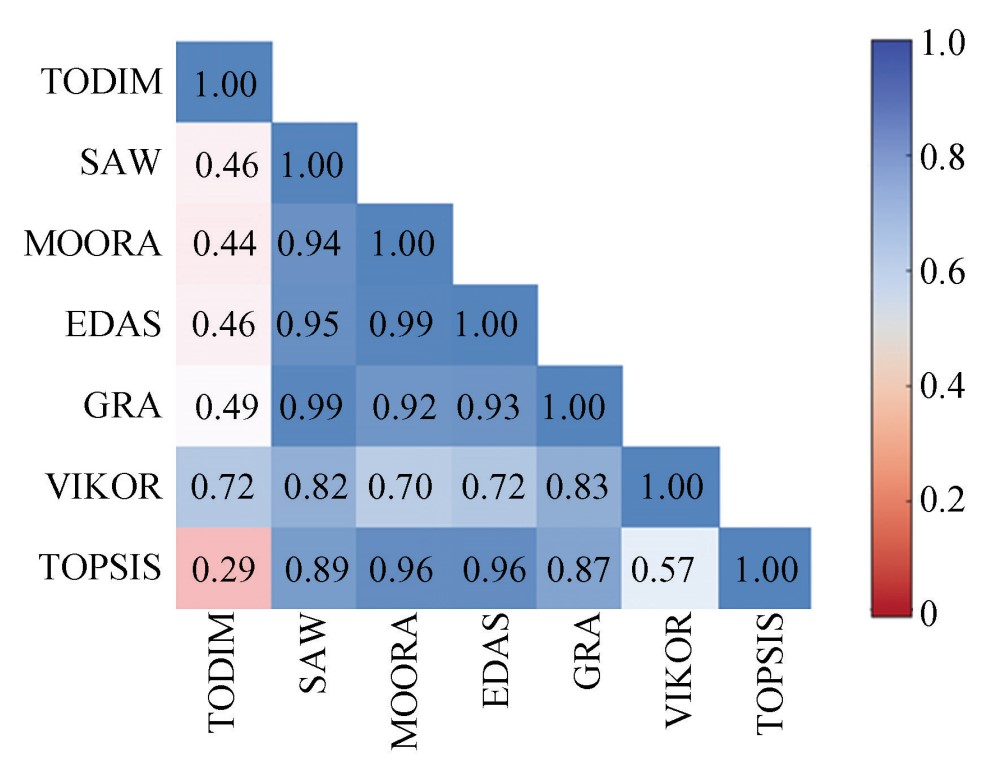
Fig.
8
Spearman‘s correlation coefficients of MCDM methods
4.3 Effect of Variation of θ on TODIM Ranking
TODIM robustness was examined by varying the sensitivity parameter θ(1-10)[33]. Since losses are penalized by the factor(-1/ θ)in Eq.(14)heavily,even small losses can influence rankings. As shown in Fig.9,A16 held rank 1 for θ from 1 to 6 and rank 2 forθ from 7 to 10,likely due to higher losses relative to A14at higher θ. A3consistently remained the worst(rank= 18),while only A12 and A14showed noticeable fluctuations,reflecting TODIM‘s non-linear gain/ loss functions. Overall,rankings were largely stable,confirming the robustness of TODIM with variation of θfor wear parameter optimization.
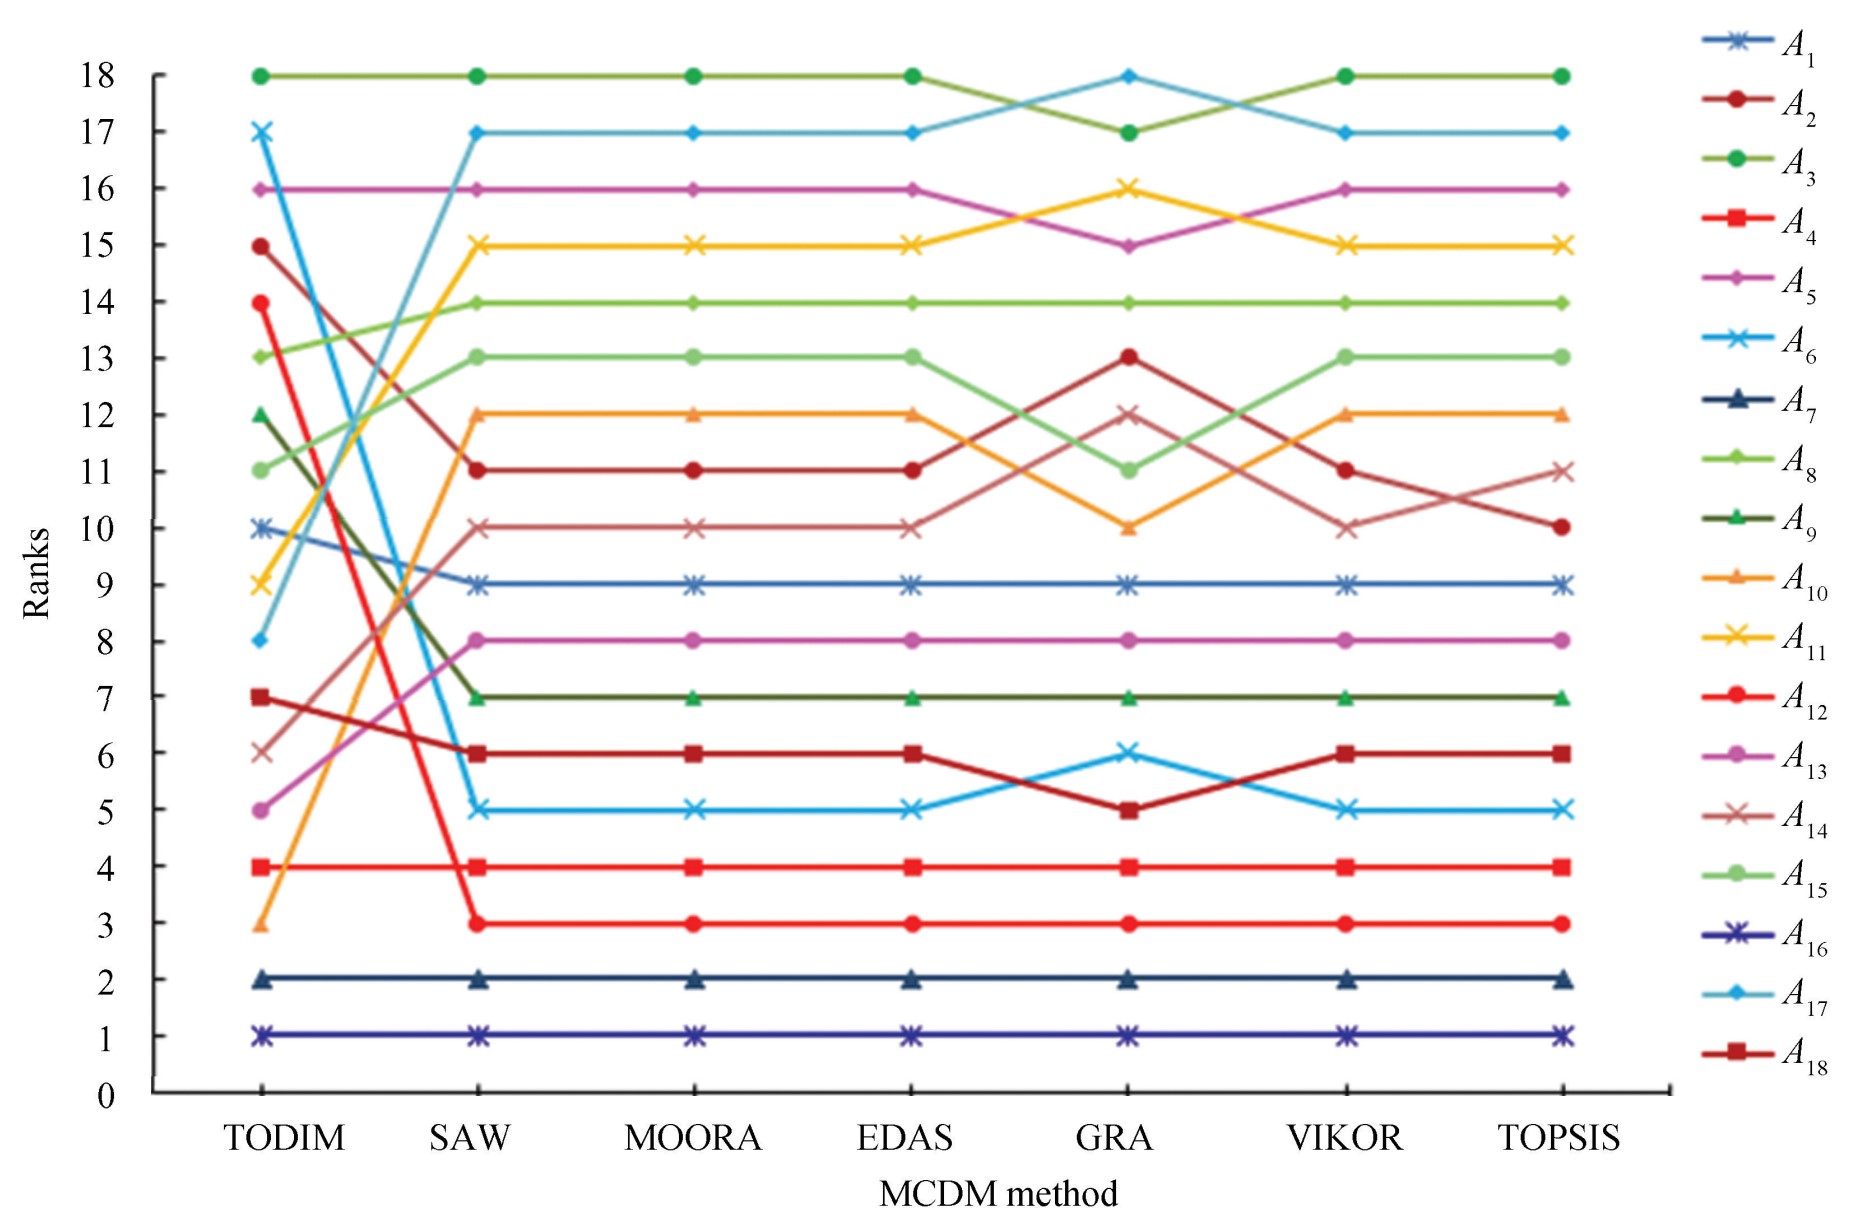
Fig.
9
Effect of θ values on ranking of alternatives
4.4 Comparison of TODIM Ranking with CDF Results
TODIM and CDF represent two distinct approaches to multi-criteria optimization. TODIM,grounded in prospect theory,evaluates alternatives through relative dominance and loss-gain functions,producing a complete ranking. In contrast,CDF is commonly applied in the design of experiments and response surface methods[47]. It converts each criterion into a desirability index(0-1)and aggregates them into an overall desirability score(D)to identify a single optimal solution. While CDF cannot rank all alternatives,its optimal results can be used to validate TODIM results.
Using Minitab 19 software with the response optimizer and desirability function,the optimal parameter levels for SWR,WE,and COF were obtained as follows:w(Al2O3)of 3%,w(Gr)of 6%,AL of 21.111 1 N,and SD of 1 000 m,with an overall desirability(D)of 0.765 8,as shown in Fig.10. TODIM identified a similar solution but with a lower AL of 10 N. Both methods highlight that a higher percentage of reinforcement content and lower sliding distance improve wear performance. The difference in one parameter level like AL is in line with earlier studies[47-48]underscoring the complementary role of TODIM and CDF in validating optimal results.
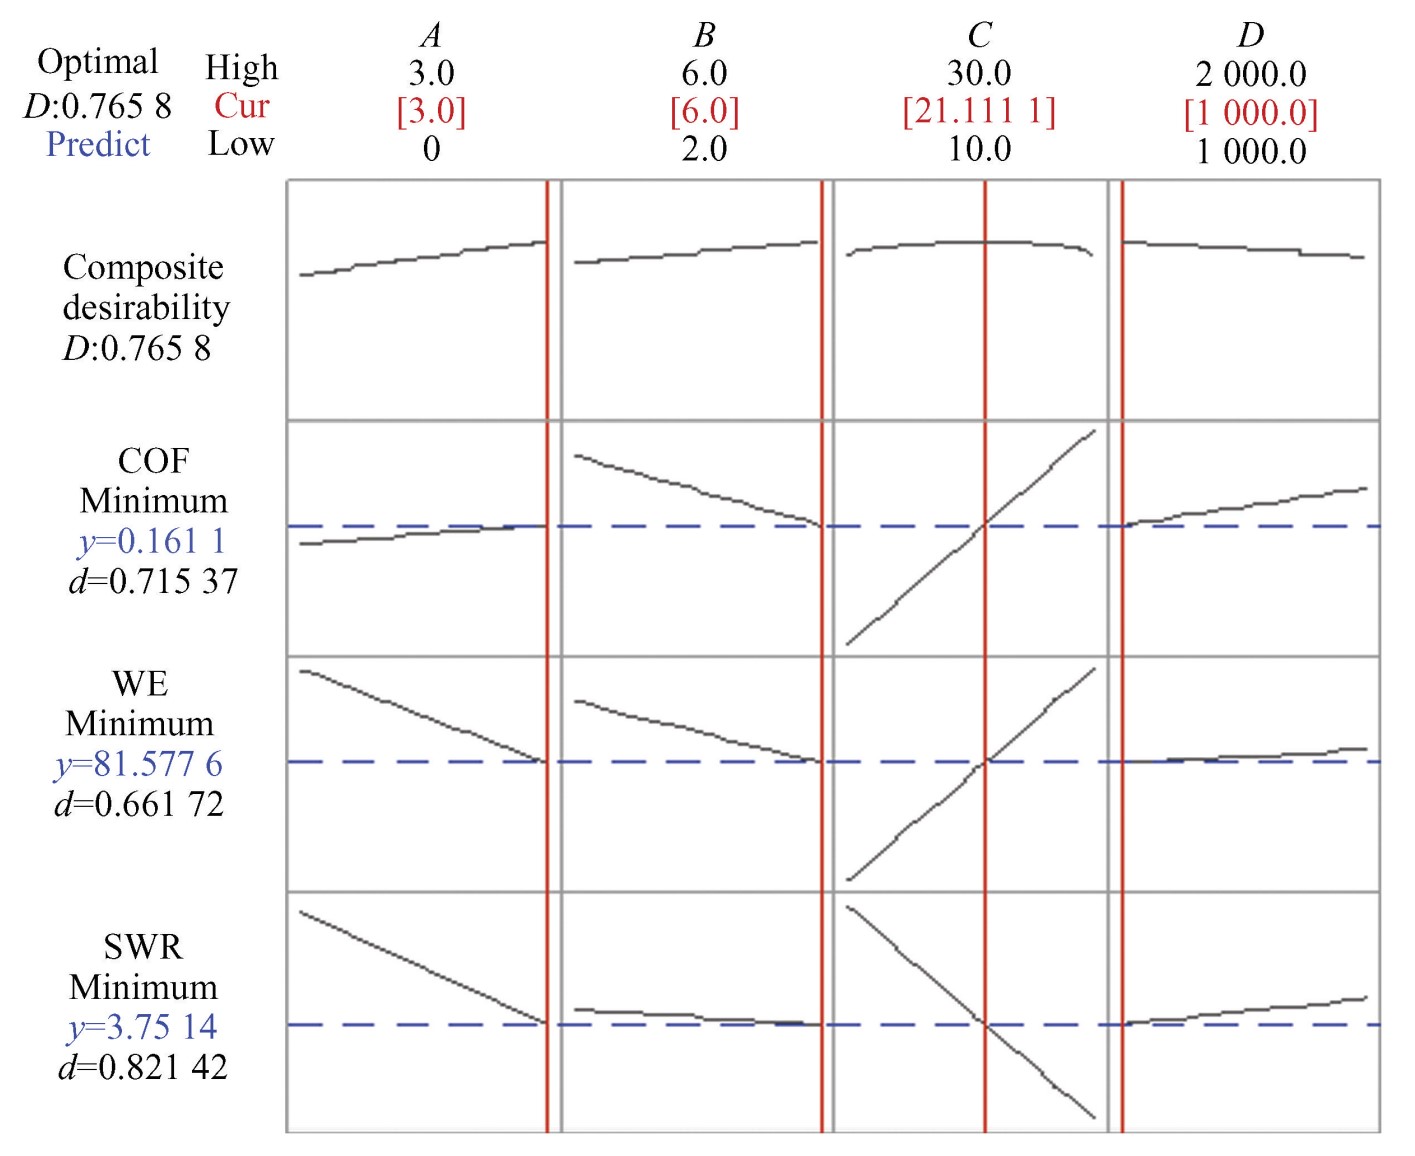
Fig.
10
Composite desirability plot
4.5 Bootstrapping for Statistical Validation of TODIM Ranking
Bootstrapping is a resampling-based statistical method that generates multiple simulated samples from a single dataset,allowing estimation of variability,standard errors,confidence intervals(CIs),and hypothesis testing without additional experiments[49]. In this study,a non-parametric bootstrap procedure was applied to ψi values to enhance the robustness of TODIM using Python. A total of 10 000 bootstrap samples were generated by resampling the data of SWR,WE,and COF with replacement,and TODIM was repeated for each sample. The resulting ψi distributions provided estimates of mean,standard deviation,and 95% CI for each alternative,thereby quantifying ranking variability.
Table 13 summarizes TODIM rankings from10 000 bootstrap resamples. The results show that top alternatives (A16,A7,A10)consistently dominate,confirming ranking stability. The CI whisker plot,as shown in Fig. 11,clearly separates top and bottom ranked alternatives. A16exhibits narrow CIs and a high probability of Rank 1,indicating statistically robust superiority. This is further supported by θ-sensitivity analysis,where A16remained Rank 1 for θ ≤ 6 and shifted only marginally at higher θ values. Overall,these findings demonstrate that A16‘s dominance is systematic and not random,thereby reinforcing the robustness and reliability of TODIM.
Table
13
Bootstrapping of TODIM rankings (Samples:10 000)
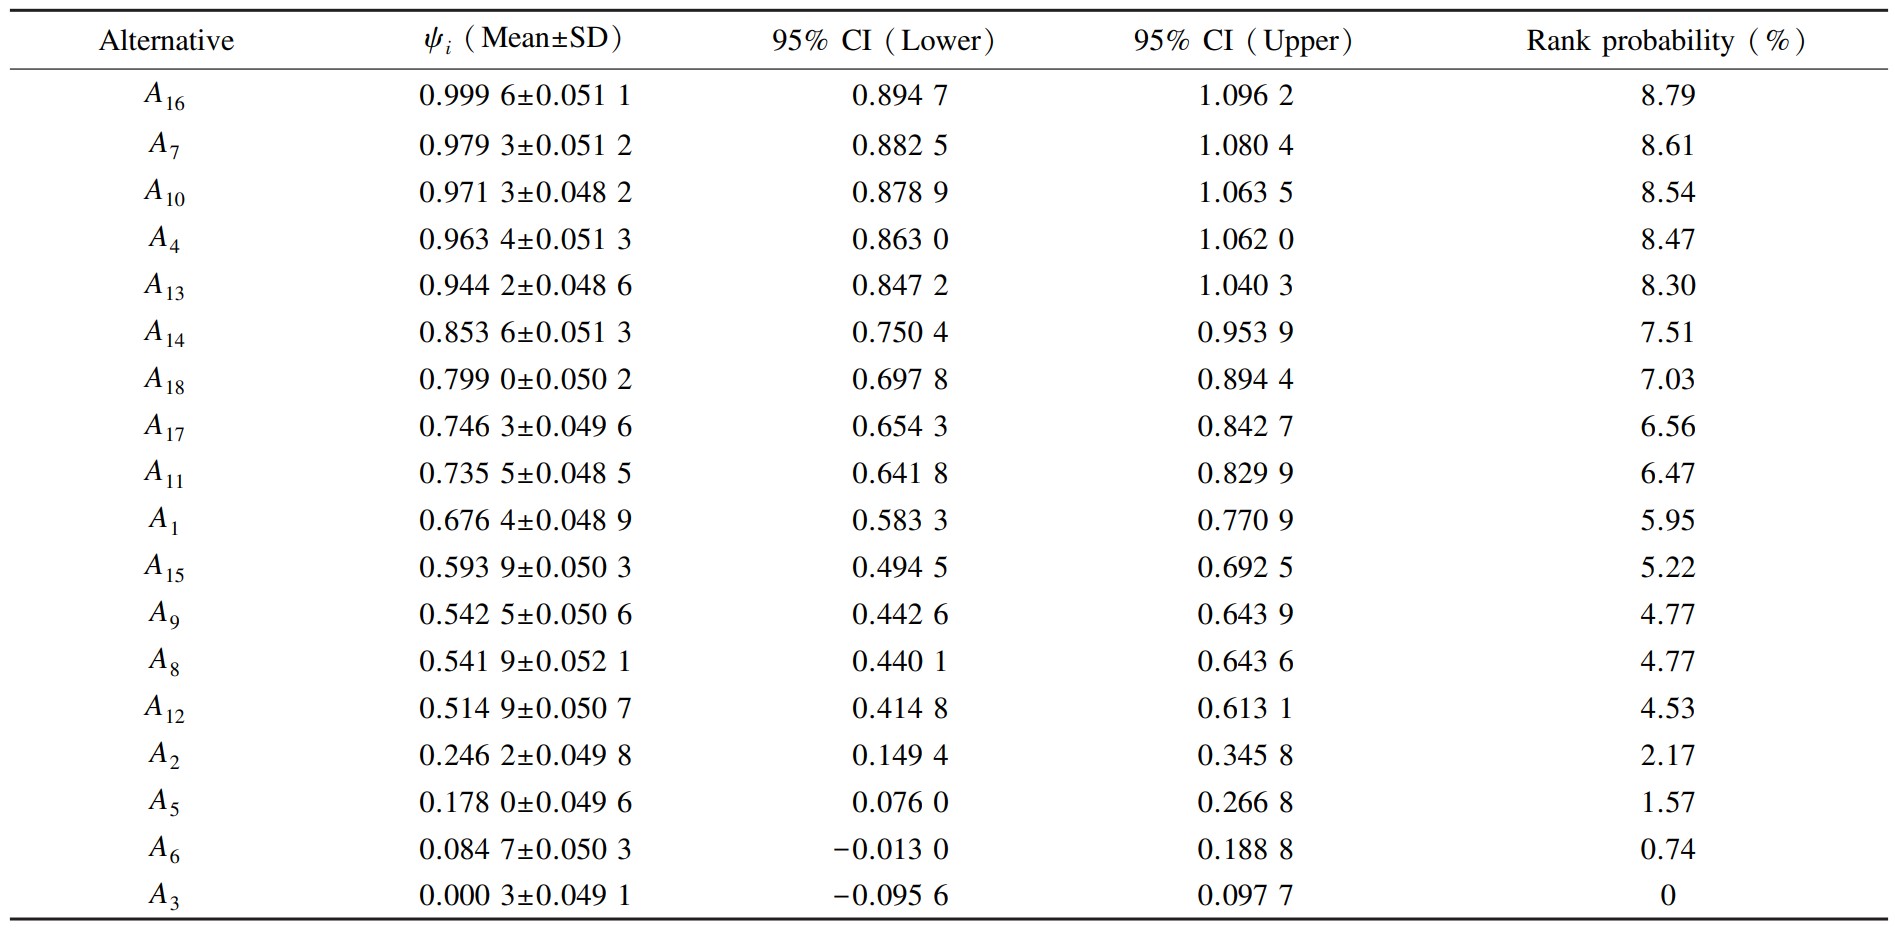
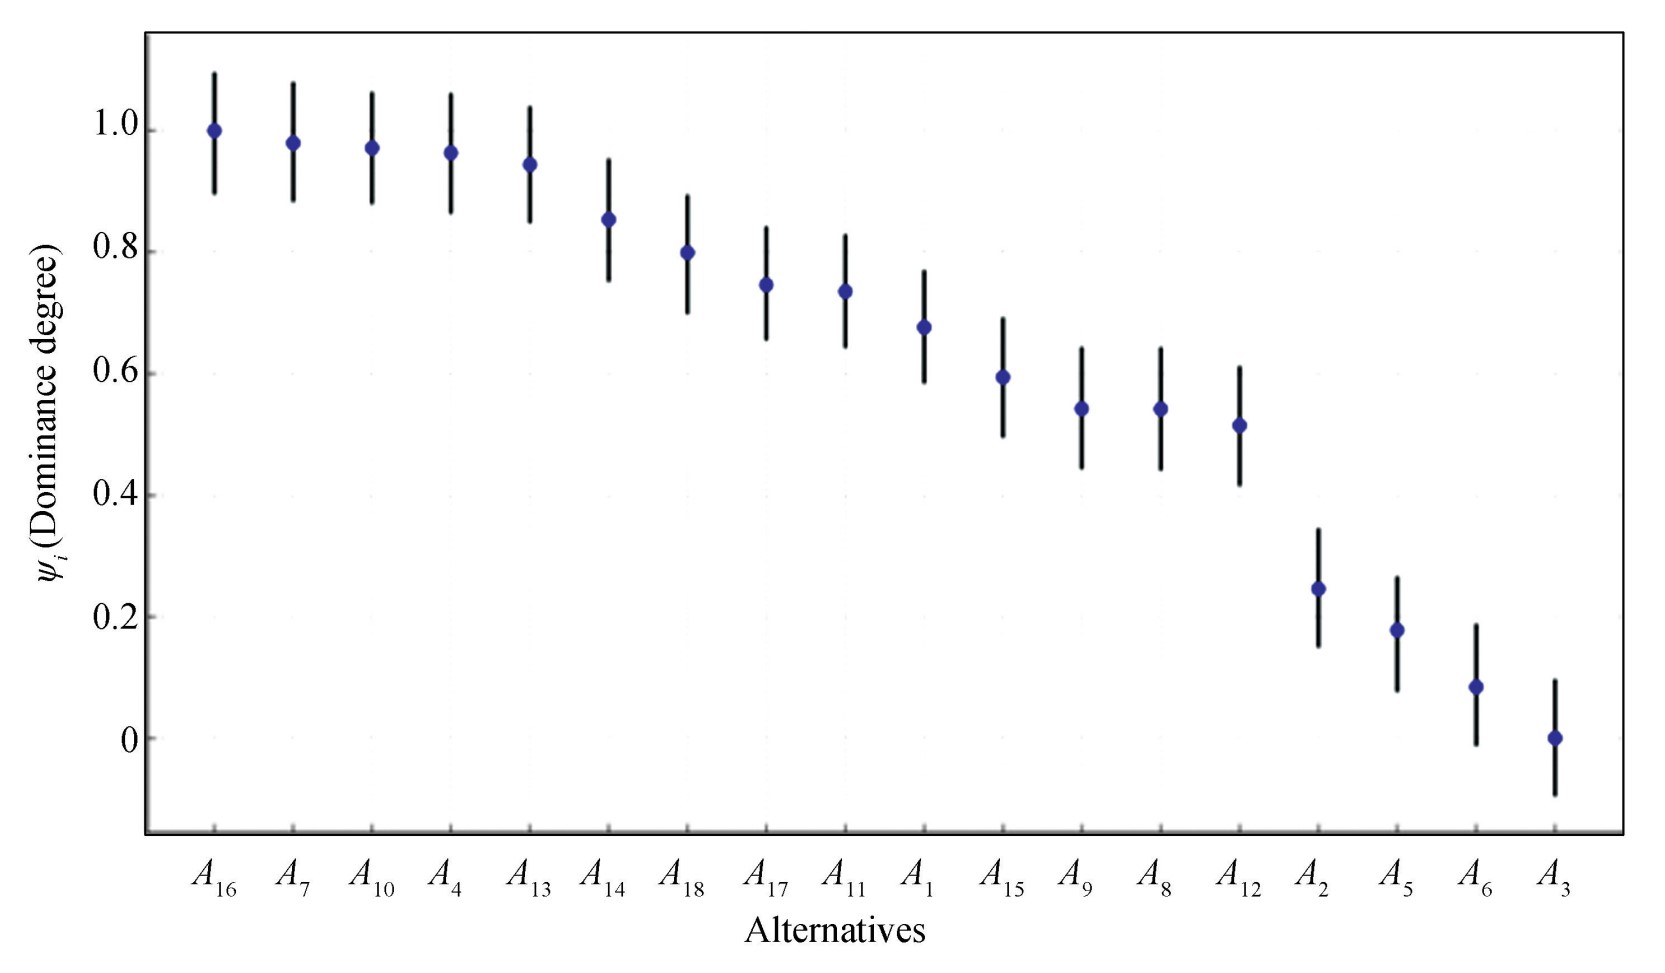
Fig.
11
Whisker plot of CIs of ψi for all 18 alternatives
5 Conclusions
Dry sliding wear tests were performed according to Taguchi‘s L18(21 ×33)OA for AA7075/ Al2 O3/ Gr HMMCs. The input parameters,such as Al2 O3,Gr,AL and SD,were varied considering the criteria such as SWR,WE and COF. An integrated approach of BWM-TODIM was used for multi-criteria optimization of SWR,WE and COF. SEM analysis was conducted to asses the surface integrity of the worn surface at optimal parameter levels of TODIM. ANOVA of ψi was performed to identify significant parameters affecting these criteria. Finally,a sensitivity analysis and statistical validation of TODIM were done to find its robustness and reliability. The findings of this study are presented as follows.
1)According to BWM,the best and worst criteria were SWR and WE,respectively. Further,the consistency ratio of pairwise comparison was found to be 0.05,which was close to zero and at an acceptable level. It means that pairwise comparisons were more consistent.
2)The BWM-TODIM approach revealed that alternative A16(A2 B3 C1 D3)was the best alternative,which provided desirable criteria,i. e.,SWR of5.554×10-4 mm3/(N·m),WE of 46.78 μm,and COF of 0.122. While alternative A3(A1B1C3 D3)was the worst alternative,which provided undesirable criteria,i. e.,SWR of 6. 452 × 10-4 mm3/(N·m),WE of 166.37 μm,and COF of 0.282. The optimal parameters led to minimum values of SWR,WE and COF during the wear process,ensuring better wear performance.
3)ANOVA results of ψi indicated that AL,Al2O3and Gr are highly significant for multi-criteria optimization of SWR,WE,and COF and provided an optimal solution A2B3C1D1. Confirmation tests indicated improvements of 41. 10%,5. 98% and19.44% in SWR,WE and COF,respectively.
4)SEM analysis of the worn surface of the best alternative,A16,showed better surface integrity in terms of grooves,delamination and wear debris than that of the worst alternative,A3. The average wear track width,groove density and pull-out areas in the worn surface of A16led to less material loss and better wear performance than A3. Thus,these results aligned with the optimized parameters suggested by BWM-TODIM.
5)The sensitivity analysis of TODIM proved that it is highly robust with the modifications of criteria weights and Rs values suggest that it has more consistency with VIKOR and less/ moderate consistency with other popular MCDM methods.Further,it is fairly robust with variation of θ values and multi-response optimizer-CDF. Lastly,bootstrapping confirmed A16and A3as the best and worst alternatives,validating the robustness and reliability of TODIM. The outcome of the sensitivity analysis is highly important since it boosts confidence in TODIM results.
6)Various industries involved in the manufacturing of aluminium hybrid composites can use this approach to refine the wear process and select the best parameters for high wear performance and longevity of components.
In view of future work,the BWM-TODIM approach can be used to address optimization problems for other types of aluminum composites and mechanical processes. This study can be further extended by selecting other subjective and objective weighing methods.
Acknowledgement
The authors would like to thank the authorities of Kakatiya Institute of Technology and Science-Warangal,Kakatiya University-Warangal and Institute of Chemical Technology-Hyderabad for providing the facilities to conduct wear tests and characterization of materials.
Conflicts of Interest
The authors declare no potential conflicts of interest.
