Abstract
The selective recognition and detection of kaempferol (KAE),a polyphenolic natural antioxidant,were successfully achieved by employing a highly fluorescent fluorene-based polymer as a sensing probe. KAE induced a remarkable fluorescence quenching efficiency of up to 82.17%,with this sensitive response rapidly reaching equilibrium and maintaining stability. The fluorescence quenching efficiency showed an excellent linear correlation with KAE concentration over the ranges of (0-45)μmol / L in ethanol and (0-30)μmol / L in PBS-ethanol mixed solutions. The corresponding limits of detection (LOD)can reach as low as 0.683 8 μmol / L in ethanol and 0.990 0 μmol / L in PBS-ethanol mixed solutions. Notably,the probe exhibited remarkable selectivity and demonstrated excellent resistance to interference,even in complex matrices containing coexisting substances. Moreover,the detection of KAE in spiked human urine samples yielded recovery rates ranging from 90.48% to 110.40%,with relative standard deviations (RSD)below 4.98%. These results demonstrate that the probe is promising in achieving high accuracy,reliability,and broad applicability in both quantitative and qualitative analysis of KAE in future applications.
Keywords
0 Introduction
Kaempferol(KAE),a flavonoid compound,presents as a yellow crystalline powder(as shown in Fig. 1). It exhibits limited solubility in water but is readily soluble in ethanol,ether,and alkaline solutions. KAE is a naturally occurring polyphenolic antioxidant that is ubiquitously present in fruits and vegetables. Owing to its remarkable pharmacological properties,including potent anti-inflammatory,antimicrobial,antioxidative,and antitumor activities,it has garnered considerable scientific interest[1]. KAE demonstrates significant therapeutic potential for treating various conditions,including cough,bronchial asthma,and diabetes,as well as in cancer chemo-prevention and cardio-protection[2-3].
However,excessive intake of KAE may cause gastrointestinal irritation,with symptoms including nausea,vomiting,and diarrhea[4]. Therefore,the development of highly sensitive and specific analytical methods for KAE quantification is essential to enable accurate dosage control in pharmacotherapeutic dosing and to facilitate comprehensive metabolic monitoring.
Currently,the analytical methodologies for KAE detection include a variety of techniques,such as high-performance liquid chromatography-mass spectrometry(HPLC-MS)[ 5],fluorescence spectroscopy[6],capillary electrophoresis[7],and electrochemical analysis[8]. Among these,fluorescence-based detection has shown particular promise due to its superior sensitivity,excellent selectivity,rapid response,and operational simplicity[ 9]. Recently,advanced fluorescent nanomaterials,including carbon dots[ 10],cadmium telluride quantum dots[2],metal-organic frameworks[11],and silicon nanoparticles[12],have been successfully applied for the identification and quantification of KAE in complex matrices,such as fruits,pharmaceutical formulations,and biological samples.
Fluorene-based compounds are widely employed as high-energy,deep-blue luminescent materials owing to their high fluorescence quantum yield and remarkable stability. The conjugated rigid planar structure endows fluorene-based polymers with outstanding fluorescence performance. Consequently,fluorene derivatives can also serve as highly efficient fluorescent sensing materials[ 13-14]. To date,fluorene-based detection systems have found extensive utility across diverse analytical domains,ranging from ionic species recognition[15]and nucleic acid detection[16]to explosive compound sensing[17].
Compared to small-molecule fluorescent probes,polymer probes-particularly conjugated polymers-exhibit the ability to respond to subtle disturbances and stimuli due to their superior photoelectric conversion efficiency and signal amplification capability. This results in significantly improved sensitivity and lower detection limits[ 18]. Additionally,several polyfluorene-based fluorescence sensors,such as water-soluble dendritic polyfluorenes[ 19]and electro-luminescent polyfluorenes[20],have been developed for applications in food safety,cell imaging,and the clinical screening of cancer biomarkers.
Although fluorene-based materials have exhibited considerable potential in analytical detection,a dedicated fluorescence sensing system for KAE remains unestablished. At the same time,the growing demand for accurate and user-friendly KAE detection in clinical and pharmaceutical settings creates an urgent need for novel fluorescent probes with improved specificity,selectivity,and stability.
Herein,a highly fluorescent polyfluorene-diaminopyridine derivative(FPD)featuring a π-conjugated backbone,as shown in Fig. 1,was employed as the sensing probe for KAE detection. FPD demonstrates a relatively high fluorescence quantum yield and responded to KAE via a pronounced quenching effect. Additionally,FPD shows high sensitivity,rapid response kinetics,and reliable analytical performance in the detection of KAE. These results not only broaden the detection methodologies for KAE but also establish a novel theoretical foundation for analysis in food safety and clinical diagnostics.
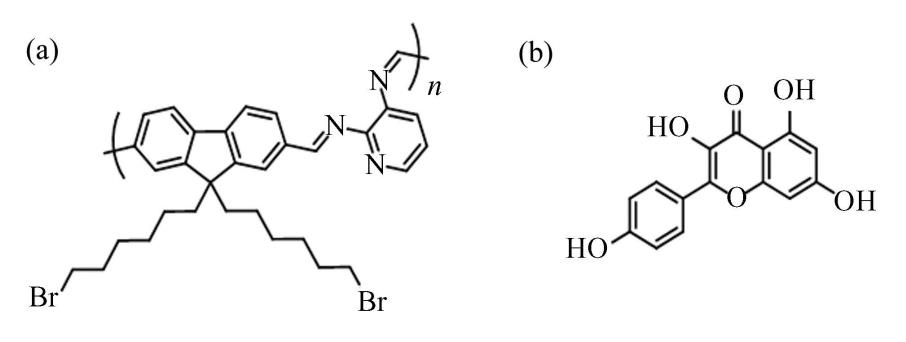
Fig.
1
Structural formula (a)FPD (b)KAE
1 Experiment Setup
1.1 Instruments and Reagents
The pH value was monitored using a digital pH meter(PT-20,Sartorius,Germany). The absorption and emission spectra were recorded at 25 ℃ using a spectrophotometer(UV6100,Mapada,China)and a fluorescence spectrometer(LS55,Perkin-Elmer,USA).
All commercial reagents were used as received without further purification. Glucose,KAE,𝛽-cyclodextrin,ascorbic acid,sodium citrate,L-proline,L-glycine,L-leucine,L-histidine,KH2PO4,K2HPO4,NaI,NaNO3,KCl,LiCl,and ZnCl2 were purchased from Shanghai Aladdin Biochemical Technology Co.,Ltd(China). Urea,ethanol 𝑁,𝑁-dimethylacetamide(DMAc),dimethyl sulfoxide(DMSO),and 𝑁,𝑁-dimethylformamide(DMF),were obtained from Tianjin Fuyu Fine Chemical Co.,Ltd(China). The experiment water was ultrapure water with a resistivity over 18 MΩ·cm-1. And the FPD was synthesized following the method described in our previous publication[21].
1.2 UV-Visible and Fluorescence Spectral Measurement
UV-Visible spectral experiments were performed at a scanning rate of 600 nm/ min with a 5 mm ×10 mm×45 mm quartz cuvette. And the fluorescence spectra were measured with the excitation wavelength of 330 nm at a scanning rate of 500 nm/ min. The slit was 15 nm,and a 10 mm × 10 mm × 45 mm quartz cuvette was used.
Eight kinds of solvents were used as solvents for ultraviolet and fluorescence spectroscopy measurements,which are DMF,DMSO and DMAc,ethanol,PBS2(PBS solutions,5 mM,pH= 7,),PBS1-ethanol(ethanol mixed with PBS solutions,𝑉PBS∶ 𝑉ethanol=1 ∶ 1,5 mM,pH= 5),PBS2-ethanol(ethanol mixed with PBS solutions,𝑉PBS∶ 𝑉ethanol= 1 ∶ 1,5 mM,pH= 7),PBS3-ethanol(ethanol mixed with PBS solutions,𝑉PBS∶ 𝑉ethanol= 1 ∶ 1,5 mM,pH= 10).
The KAE was dissolved in purified water at a concentration of 10 mM for the stock solution,and diluted for further use. FPD was dissolved in eight solvents to prepare a 1 600 μL solution at a concentration of 2 μmol/ L,respectively. Subsequently,an appropriate amount of KAE was added and the mixture was stirred evenly.
1.3 KAE Titration and Limit of Detection(LOD)
KAE was added to FPD solvents at concentrations of 0,5,10,15,20,25,30,35,40,45,60,80,100,150 and 200 μmol/ L,respectively,and fluorescence intensity was recorded with the excitation wavelength of 330 nm. The linear range of KAE detection concentration and its lowest detection limit were determined by constructing the standard curve equation.
1.4 Detection of KAE in Urine Samples
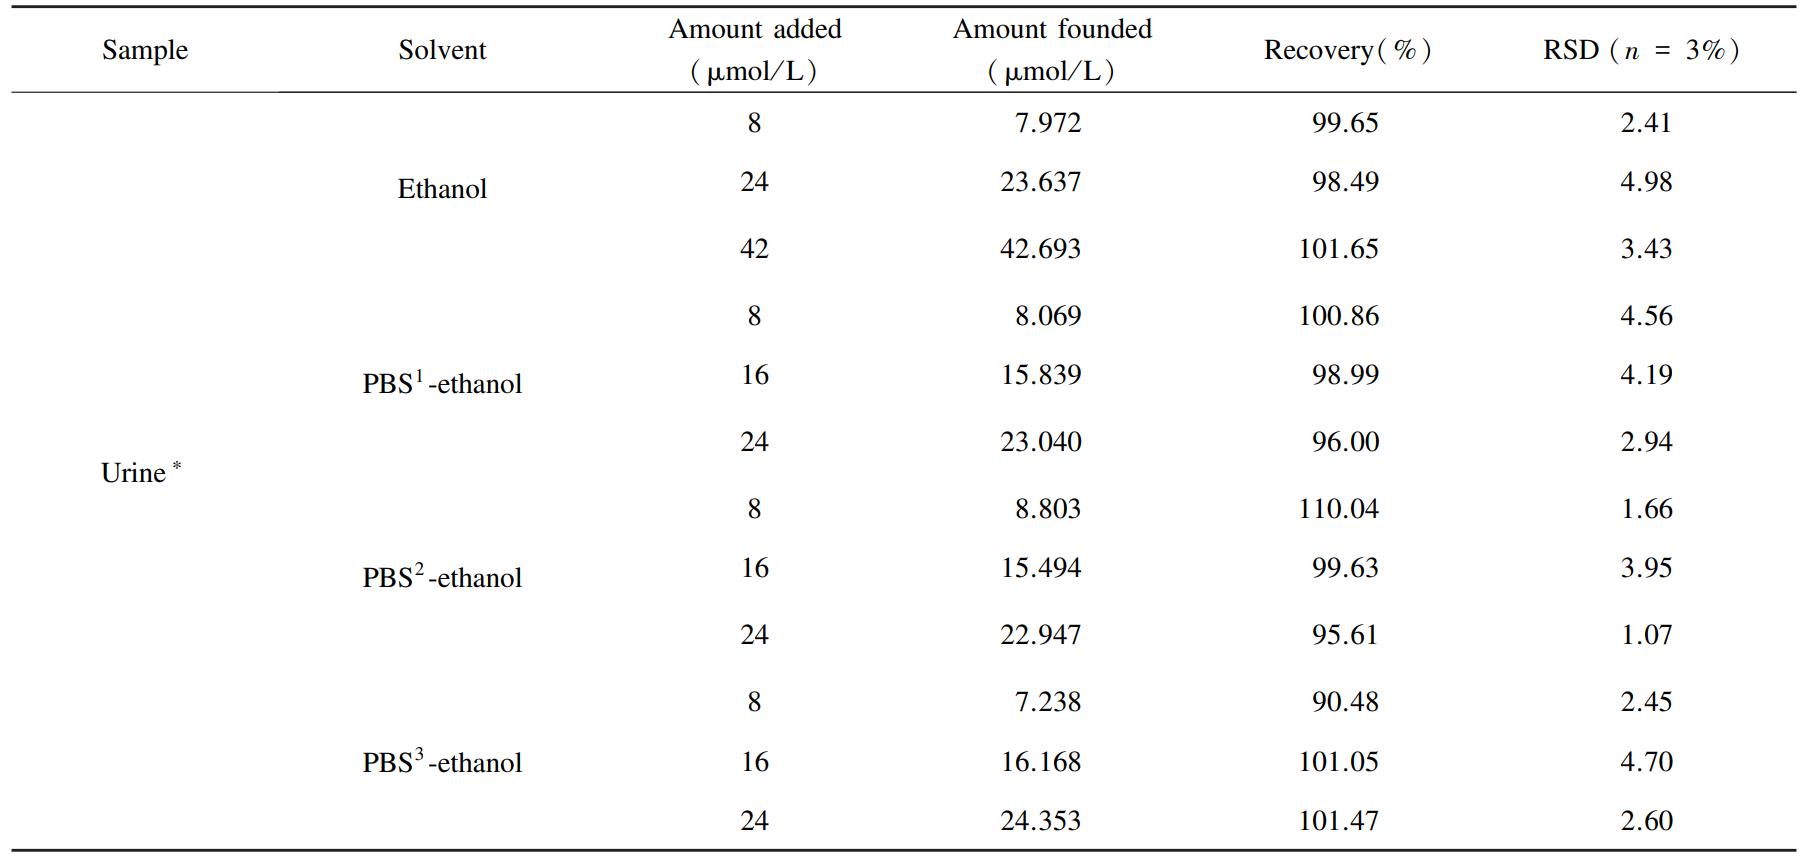
Healthy human urine was selected as the actual test sample,and its preparation method was referred to a previously published method[ 22]. The urine sample was centrifuged at 12 000 r/ min for 10 min,and the resulting supernatant was diluted 100-fold.Subsequently,KAE was added to the prepared sample for further analysis.
2 Results and Discussion
2.1 Optimization of Detection Conditions
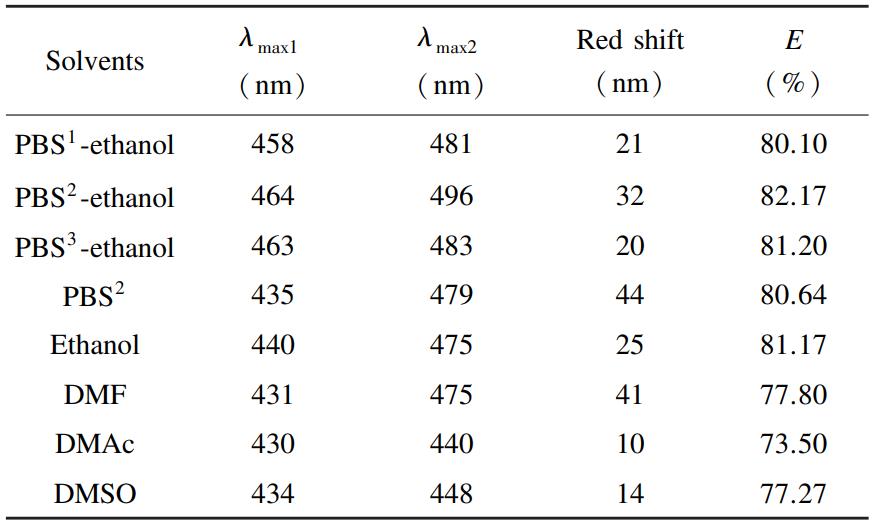
To ensure optimal compatibility between the solvents and the molecular environment of KAE,eight distinct solvents,which are PBS²,PBS¹-ethanol,PBS²-ethanol,PBS³-ethanol,ethanol,DMF,DMAc,and DMSO,were systematically evaluated. As depicted in Fig. S1 in Supporting Information,the fluorene-based polymer FPD demonstrated significant fluorescence activity across all solvent environments,with characteristic emission peaks observed at 458,464,463,440,431,430,434,and 435 nm,respectively. Upon introducing 200 μM of KAE into each solvent,the fluorescence intensity of FPD markedly decreased,and the emission peaks exhibited bathochromic shifts ranging from 10 nm to 44 nm(specifically,21,32,20,44,25,41,10,and14 nm,as detailed in Table 1). To quantitatively assess the solvent-dependent fluorescence quenching behavior,Eq.(1)[23] was employed to calculate the quenching efficiency(𝐸):
(1)
where,𝐹₀ represents fluorescence intensity of FPD;𝐹 represents fluorescence intensity of FPD after the addition of KAE.
As shown in Fig. 2,the fluorescence quenching efficiencies of FPD in the eight solvents were determined to be 80. 10%,82. 17%,81.20%,80.64%,81. 17%,77.80%,73. 50%,and 77.27% respectively,where FPD is 2 μmol/ L,and KAE is 200 μmol/ L in all solvents. Among the four organic solvents,ethanol and DMF have relatively high quenching efficiencies. However,compared to DMF,ethanol has significant advantages such as low cost,safe use,and lower toxicity. Therefore,ethanol is more suitable as the solvent choice in the detection process. Additionally,a comparative analysis revealed that the fluorescence emission intensity of FPD in the PBS²-ethanol mixture was approximately twice that observed in pure PBS²,with a superior quenching efficiency. These findings indicate that a 1 ∶ 1(volume/ volume)PBS-ethanol mixture simultaneously reduces polymer consumption and enhances detection performance. This optimized solvent system is particularly advantageous for practical applications,as KAE,a naturally occurring phytochemical,often enters ecosystems through industrial wastewater from extraction and processing.Consequently,KAE is more frequently encountered in mixed organic and inorganic buffering environments with varying pH levels rather than in pure solvent systems. Based on the spectral data,solubility of KAE,and practical considerations,four representative solutions,pure ethanol,PBS¹-ethanol,PBS²-ethanol,and PBS³-ethanol,were selected for further investigations.
Table
1
Summary of fluorescent emission spectral properties in different solvents
2.2 Fluorescence Response Time
To systematically investigate the rapid and stable detection capability of FPD toward KAE,a comprehensive evaluation of its temporal response characteristics was performed. As illustrated in Fig. 3,in ethanol system(data for other systems are provided in Fig.S2 in Supporting Information),the fluorescence intensity(𝜆em= 440 nm)decreased by 81.17%immediately upon introducing KAE(200 μmol/ L)into the FPD(2 μmol/ L)solution within the instrumental response time. The error bars represent the standard deviation of triplicate experiments.Notably,during the 300 s,the signal demonstrated exceptional stability with no discernible fluctuations.Furthermore,this rapid and sustained response was reproducibly observed in three other PBS-ethanol mixed solution systems(as shown in Fig. S2 in Supporting Information). Collectively,these results demonstrate that FPD serves as an efficient and reliable fluorescent probe for the real-time and rapid monitoring of KAE.
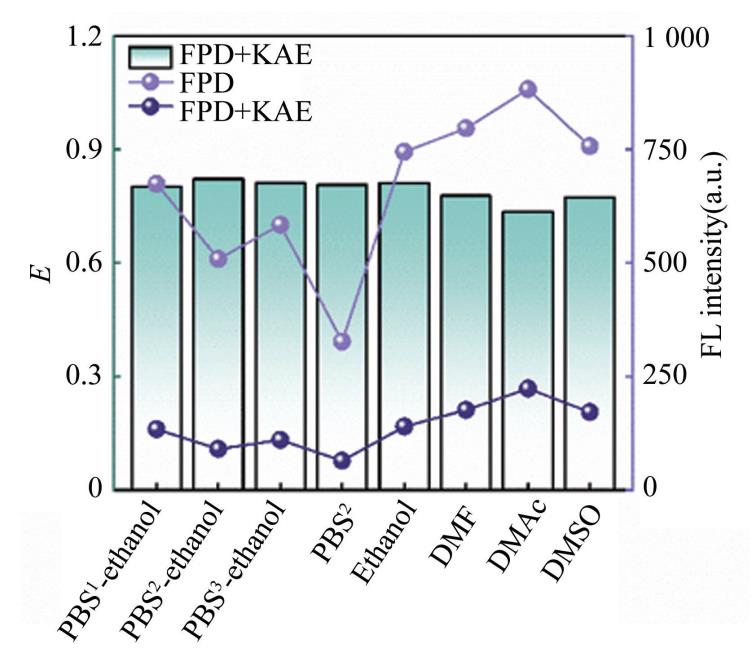
Fig.
2
Fluorescence quenching efficiency of KAE to FPD in different solvents
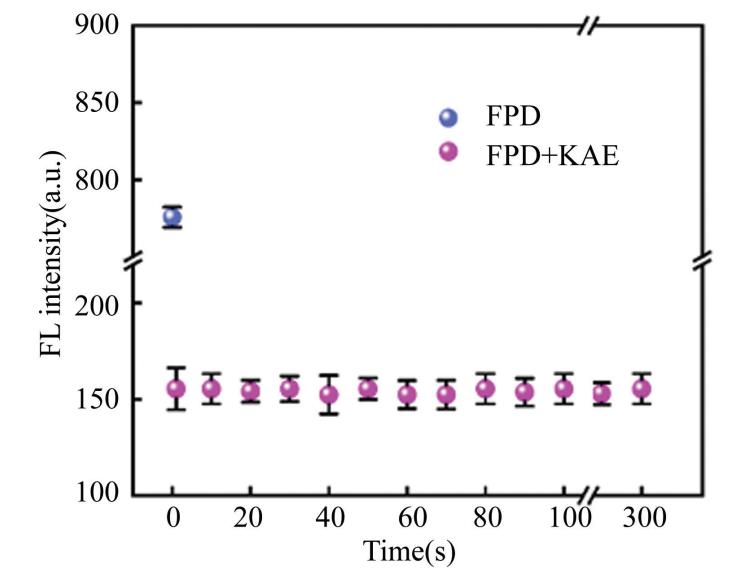
Fig.
3
The fluorescence intensity changes of FPD with time after the KAE addition in ethanol at 440 nm
2.3 KAE Fluorescence Titration and Limit of Detection
To investigate the relationship between the fluorescence quenching efficiency and the concentration of KAE,fluorescence titration experiments were systematically performed. Fig.4 indicates the emission spectrum with an excitation wavelength(𝜆ex)of 330 nm and a fixed FPD concentration of 2 μmol/ L,and the error bars represent the standard deviation of triplicate experiments. As shown in Fig. 4 and Figs.S3-S5 in Supporting Information,a concentration-dependent fluorescence quenching effect of KAE towards FPD was observed upon the incremental addition of KAE(FPD:2 μmol/ L,KAE:200 μmol/ L,the error bars represent the standard deviation of triplicate experiments). Notably,in the ethanol medium,the quenching efficiency exhibited an excellent linear correlation(𝑅²= 0.999 6)with KAE concentrations ranging from 0 to45 μmol/ L. Based on the Stern-Volmer plots,the detailed derivations of the regression equation and low detection limit(𝐿LOD)calculation are provided in Eqs.(S1)and(S2)[24]. The linear regression can be expressed as:(𝐹0-𝐹)/ 𝐹0= 0. 012 3(± 0. 000 4)𝐶KAE-0.018 3(±0.003 5),with a remarkably LOD of0.683 8 μmol/ L. A comprehensive summary of all analytical parameters is presented in Table 2.
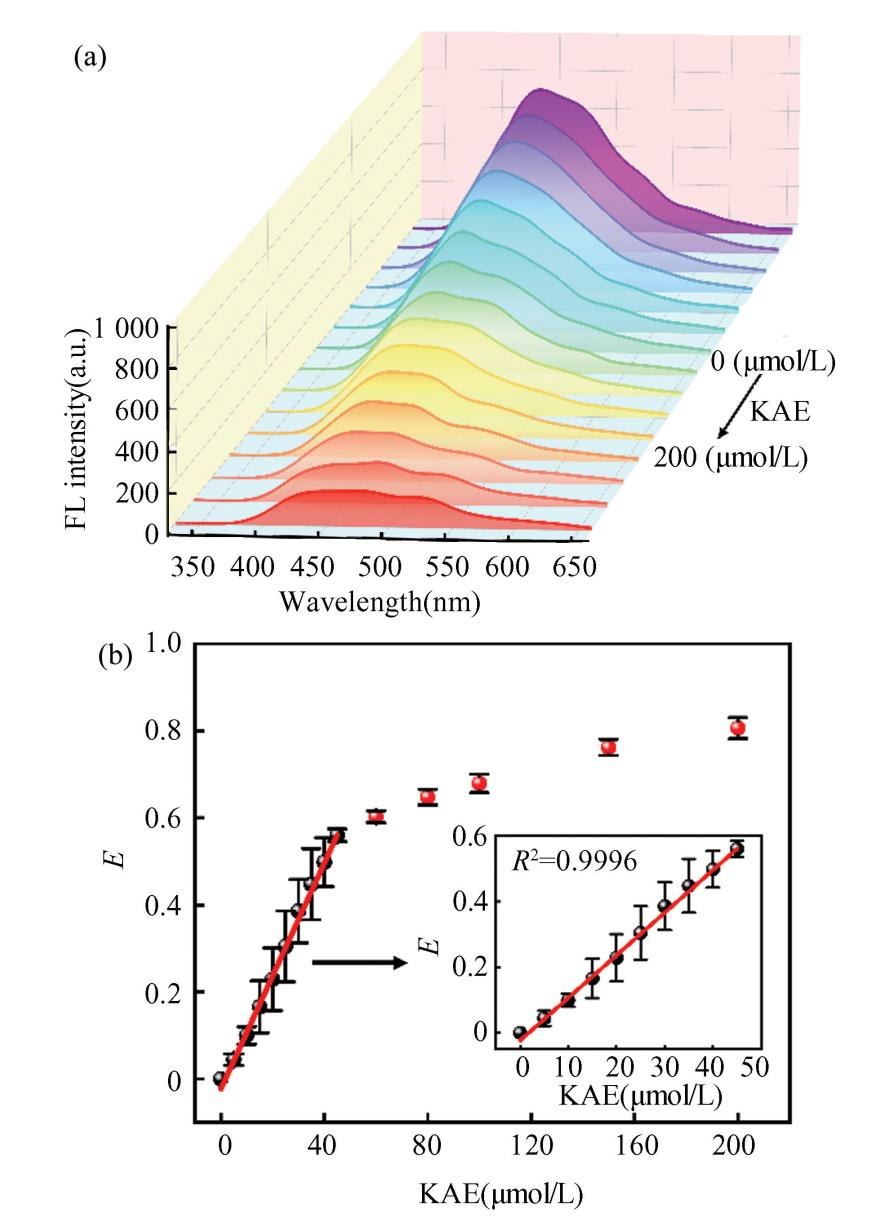
Fig.
4
(a)Fluorescence emission spectra of FPD in ethanol with increasing KAE concentrations;(b )The linear fitting of fluorescence quenching efficiency with the furaltadone concentration (0 - 200 μM)in ethanol
Table
2
Detection performance of FPD for KAE in different solvents

Note:All tabulated data represent mean values calculated from triplicate experiments.
2.4 Selectivity and Anti-Interference of FPD in KAE Detection
To evaluate potential matrix effects in the practical detection of KAE,the interference from 15coexisting substances was systematically investigated,including organic molecules,saccharides,food additives,amino acids,and ionic species. Urea,glucose,𝛽-cyclodextrin,ascorbic acid(Vitamin C),sodium citrate,L-proline,L-glycine,L-leucine,L-histidine, and with the same equivalent,were selected for selective and anti-interference studies. As shown in Fig.5(a),the fluorescence quenching efficiency induced by interferents(-1. 85% to 5. 62%)was negligible compared to that of KAE(200 μmol/ L).Furthermore,Fig.5(b)indicates that all interferents caused less than 7.62% signal perturbation during KAE detection,thereby confirming the exceptional selectivity and anti-interference capability of FPD(2 μmol/ L)in ethanol. The error bars in Fig. 5represent the standard deviation of triplicate experiments. Notably,this superior performance was consistently maintained in PBS¹-ethanol,PBS²-ethanol,PBS³-ethanol,(as presented in Figs. S6-S8 in Supporting Information),demonstrating excellent environmental adaptability.
2.5 Fluorescence Quenching Mechanism
Fluorescence quenching is primarily attributed to the synergistic interplay of multiple mechanisms,including intermolecular interactions,charge and energy transfer processes,as well as alterations in molecular properties. When a chromophore-containing detection reagent interacts with the analyte,changes in both the absorption spectrum and fluorescence spectrum are typically observed. As depicted in Fig.6,the introduction of KAE(200 μmol/ L)resulted in bathochromic shifts of the absorption maxima of FPD(2 μmol/ L)from 339 nm to 367 nm in ethanol. Red shifts are also observed in PBS-ethanol mixed solutions(Figs. S9-S11 in Supporting Information),the absorption maxima of FPD from 332 nm to 369 nm(in PBS¹-ethanol),332 nm to 377 nm(in PBS²-ethanol),and 341 nm to 384 nm(in PBS³-ethanol),respectively. These significant red shifts(Δ𝜆=28-43 nm)clearly indicate the formation of J-aggregates[25].
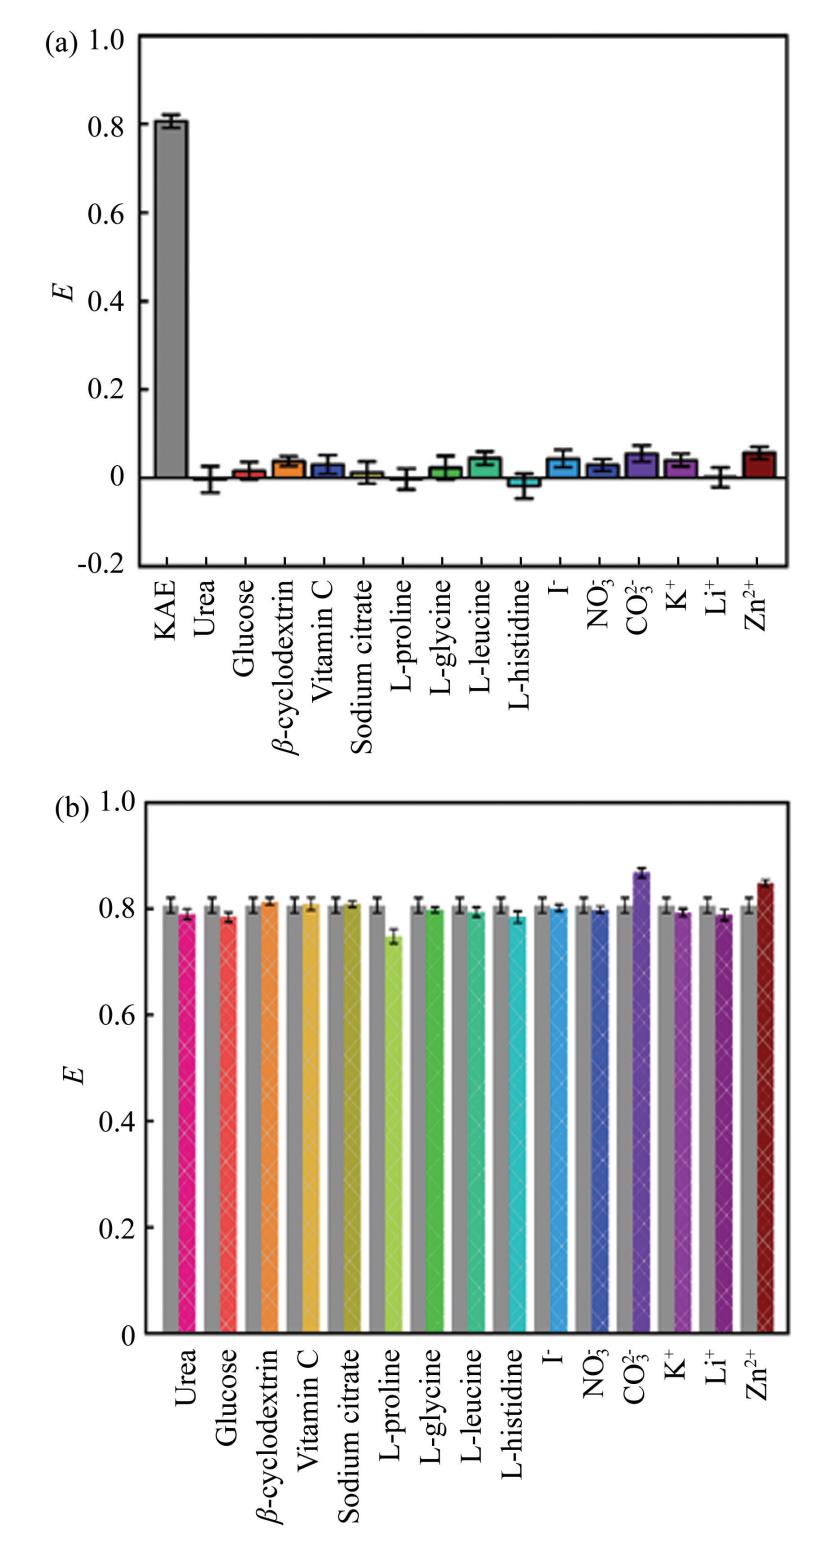
Fig.
5
(a)Fluorescence response of FPD to different interfering substances in ethanol;(b )Interference rate of KAE detected by FPD in ethanol
In addition,when fluorescence quenching is of the static quenching type,the addition of a quencher leads to the formation of ground-state complexes,thereby inducing alterations in the ultraviolet-visible absorption spectra. The variation of the spectrum can also be assessed by analyzing whether the difference in the absorption spectrum is positive or negative,i.e.,whether the absorption spectrum exhibits a hyperchromic or hypochromic effect[26].
As shown in Fig. 6(a),the difference spectrum(in ethanol),obtained by subtracting the absorption curve of FPD alone(solid line a)from that of the FPD-KAE mixed system(solid line c)(dotted line c-a)does not overlap with the absorption curve of KAE(solid line b). A 15. 28% increase in the maximum absorption peak is observed,indicating a pronounced hyperchromic effect. Similar hyperchromic effects are also evident in other solvent systems,with enhancement magnitudes of 1. 98%(in PBS¹-ethanol),4.46%(in PBS²-ethanol),and 3.15%(in PBS³-ethanol),respectively(as presented in Figs. S9-S11 in Supporting Information). These results confirm that static quenching is the predominant mechanism.
Furthermore,a significant spectral overlap exists between the emission spectrum of FPD and the absorption spectrum of KAE,as shown in Fig.6(b),suggesting that the internal filter effect(IFE)[27-28]is one of the contributing factors to fluorescence quenching. Furthermore,the electron-deficient hydroxyl groups in KAE and the electron-donating properties of the π-conjugated backbone in FPD(particularly the lone pairs of electrons on the imine nitrogen)promote an efficient electron transfer(ET)process[29]
Finally,fluorescence anisotropy measurements were performed to investigate the impact of molecular aggregation on the fluorescence quenching of FPD caused by KAE. In systems where molecules are homogeneously dispersed in solution,the anisotropy value 𝑟 remains constant. By contrast,when molecular interactions promote aggregate formation,the effective size of the fluorophores increases,thereby reducing their rotational mobility and consequently enhancing the anisotropy value. The value of 𝑟 can be calculated using Eqs.(2)and(3)[30]:
(2)
where 𝐺 denotes the correction factor,𝐼VV and 𝐼VH represent the emission intensities when both excitation and emission polarizers are vertically aligned,when the excitation polarizer is vertical and the emission polarizer is horizontal,respectively.
(3)
where 𝐼HV and 𝐼HH are the intensities for horizontal excitation with vertical and horizontal emission detection,respectively.
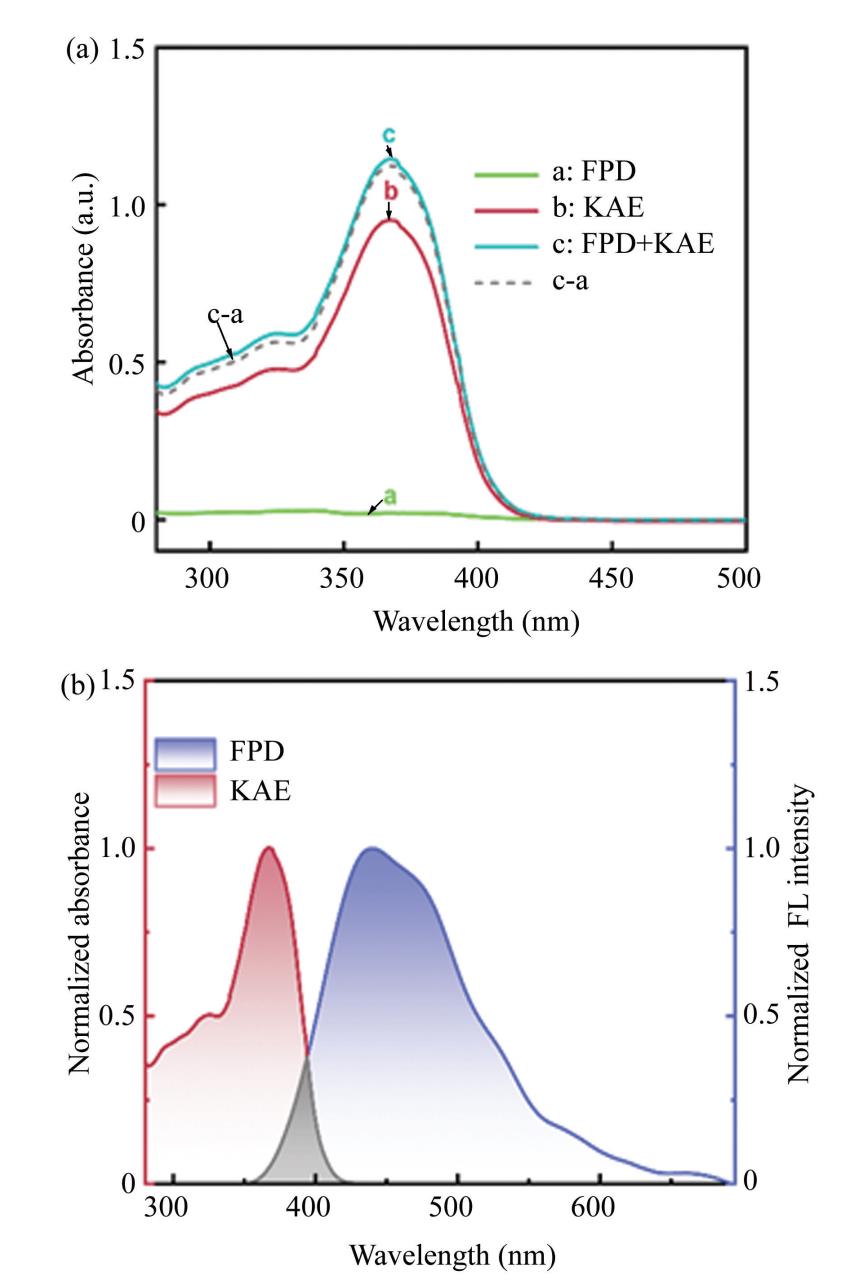
Fig.
6
(a)Ultraviolet-visible spectrum after FPD and KAE interaction in ethanol;(b )Normalized FPD fluorescence emission spectra and KAE UV-VIS absorption spectra in ethanol
As illustrated in Fig. 7,the anisotropy r values increased significantly from 0. 065 to 0. 571(in ethanol),0.143 to 0.487(in PBS¹-ethanol),0.118 to0. 382(in PBS²-ethanol),0. 167 to 0. 547(in PBS³-ethanol),respectively. In the freely dispersed state,FPD progressively forms aggregates with KAE.As the concentration of KAE increases,the size of these aggregates gradually enlarges,thereby restricting the rotational freedom of FPD,decreasing its rotational rate,and consequently enhancing the 𝑟 value[31]. In Fig.7,FPD is 2 μmol/ L,KAE is 200 μmol/ L,the error bars represent the standard deviation of triplicate experiments.
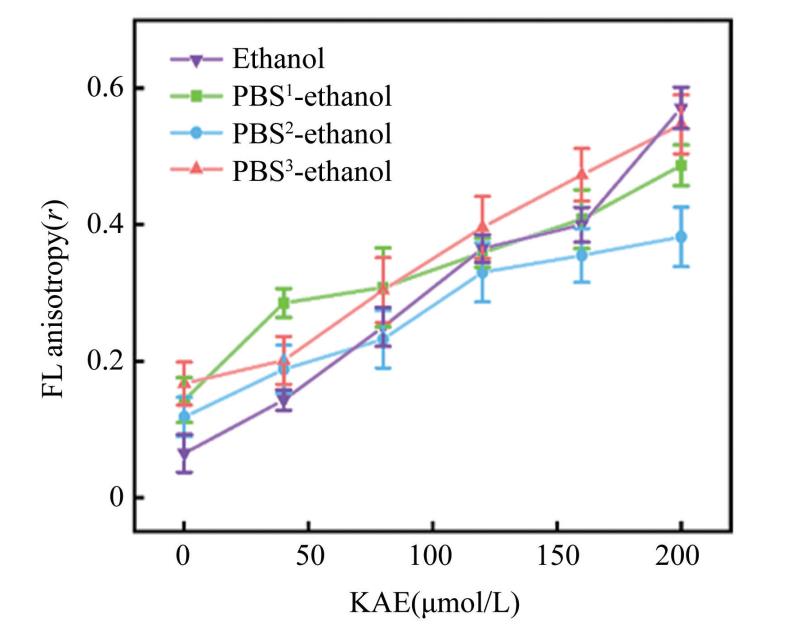
Fig.
7
Fluorescence anisotropy values r of FPD-KAE interactions in different solvent
The formation of aggregates can be attributed to the imine bonds in FPD readily forming hydrogen bonds with the hydroxyl groups in KAE,as well as their conjugated structures promoting π-π stacking interactions[32-33]. This aggregation not only strengthens the interaction between the two components but also facilitates efficient electron and energy transfer,ultimately enhancing the fluorescence quenching phenomenon. These synergistic effect of multiple quenching mechanisms leads to the fluorescence quenching of FPD by KEA,as shown in Fig. 8.
2.6 Detection of KAE in Urine Samples
Despite its significant chemo-preventive potential,the clinical utility of KAE is constrained by low bio-availability and rapid renal clearance. To assess the analytical performance of the probe for detecting KAE under physiologically relevant conditions,spiked urine sample experiments were performed using human urine. As presented in Table 3,the recovery rates were ranged from 98.49% to 101. 65%(in ethanol),96.00% to 100. 86%(in PBS¹-ethanol),95. 61% to110.04%(in PBS²-ethanol),and 90.48% to 101.47%(in PBS3-ethanol),respectively. The relative standard deviations(RSDs)were 2. 41%-4.98%,2. 94%-4.56%,1. 07%-3.95%,and 2.45%-4. 70%. These findings demonstrate that the FPD fluorescent probe exhibits high accuracy and reproducibility in detecting KAE in real samples,thereby underscoring its substantial practical significance.
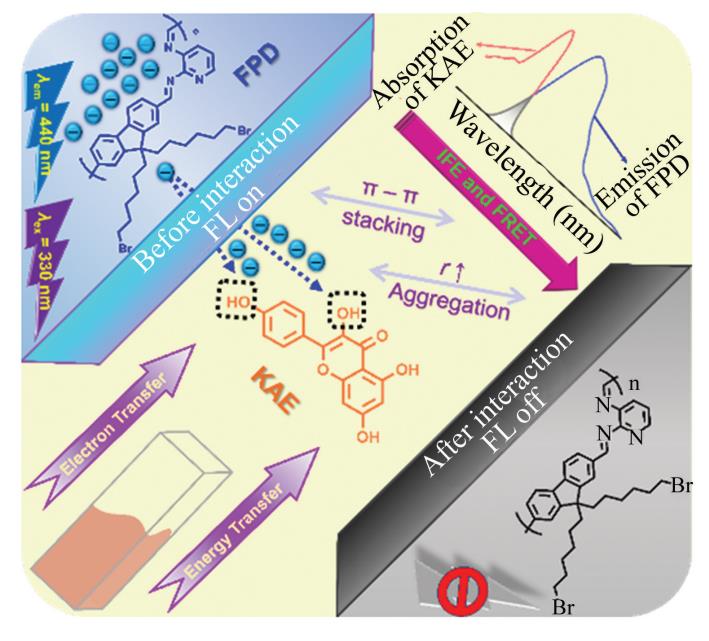
Fig.
8
Schematic illustration of the fluorescent detection of KAE using FPD
Table
3
The analytical performance of FPD for KAE detection in urine
Note:“∗”denotes 100-fold diluted healthy human urine samples,all the tabulated data represent mean values calculated from triplicate experiments.
3 Conclusions
Herein,a highly sensitive fluorescence detection and sensing platform based on the polyfluorene FPD was selected in this study and realized rapid and accurate recognition of KAE. The sensor exhibits exceptional performance characteristics,including instantaneous response,remarkable operational stability,and convenient implementation for users,while maintaining broad applicability across diverse matrices. This research not only provides a novel methodological paradigm for the efficient and precise detection of KAE,but also expands the application scope of fluorene materials in the field of fluorescence detection,and is expected to offer a solid technical reference for related medical research and clinical applications.
Conflict of Interest
The authors declare no potential conflict of interest.
Supporting Information
1. Equations
(S1)
In Eq.(S1),𝐶KAE represents concentration of KAE,𝐾 stands for slope of the linear regression equation,and 𝑏 is intercept of the linear regression equation.
(S2)
where 𝜎 stands for the standard deviation of 10measurements of FPD fluorescence intensity,𝐾 is slope of the standard curve.
2. Figures
In the PBS1-ethanol solvent,the fluorescence quenching efficiency of the interfering substances for FPD was-8.79%-10.66%,and the interference rate affecting the detection of KAE by FPD was within6.56%.
In the PBS2-ethanol solvent,the fluorescence quenching efficiency of the interfering substances for FPD ranged from-9.77% to 7.82%,and the interference rate affecting the detection of KAE by FPD was within 10.86%.
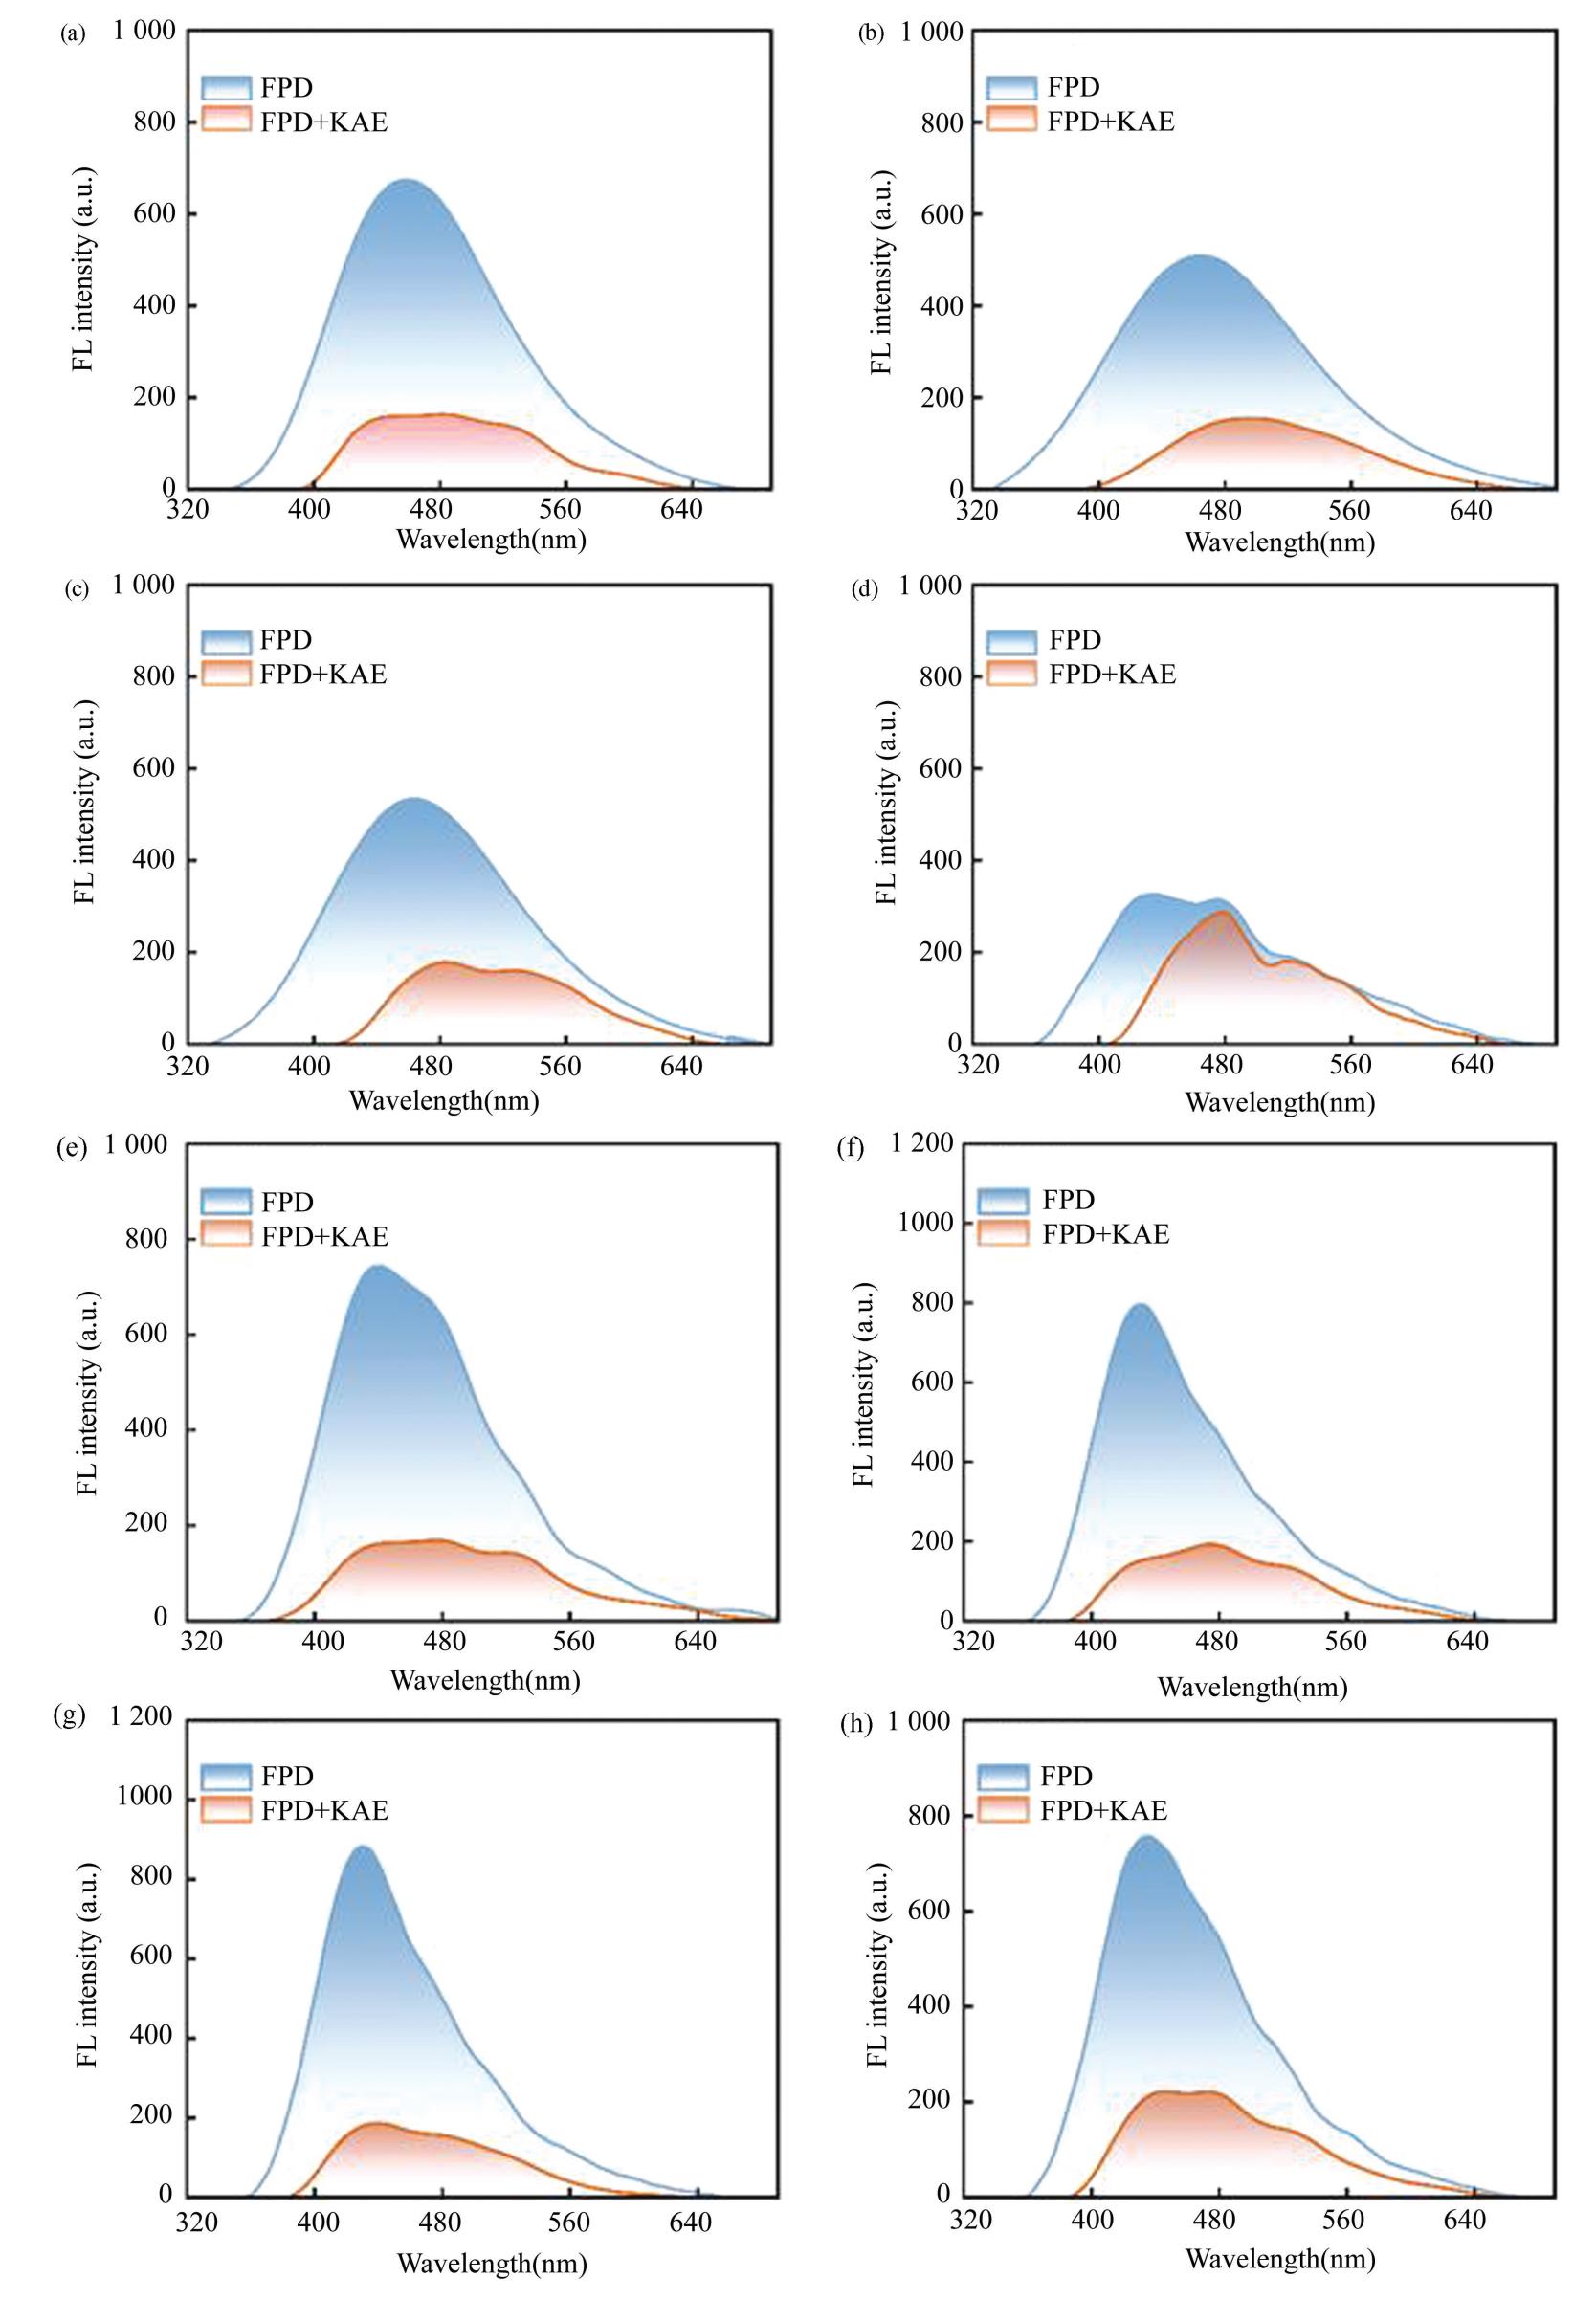
Fig.S1 Fluorescence emission spectra of FPD and KAE in different solvents:(a)In PBS1-ethanol;(b)In PBS2-ethanol;(c)In PBS3-ethanol;(d)In PBS2;(e)In ethanol;(g)In DMAc;(h)In DMSO
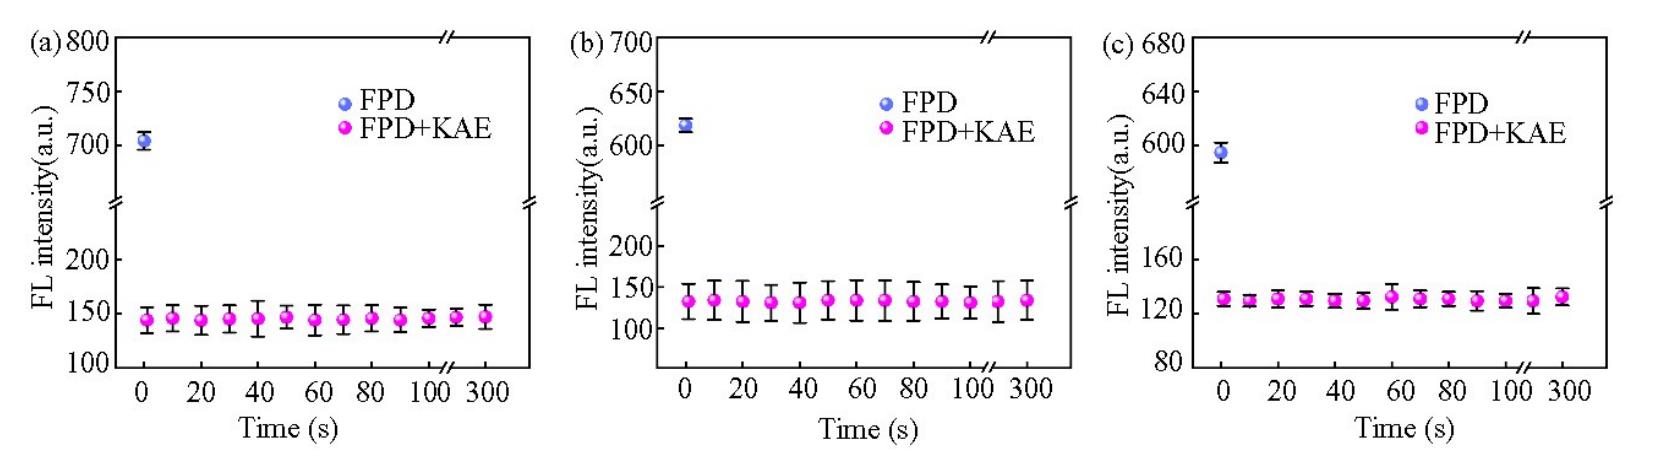
Fig.S2 The fluorescence intensity changes of FPD against with time after the KAE addition in(a)PBS1-ethanol at 458 nm,(b)PBS2-ethanol at 464 nm,(c)PBS3-ethanol solvents at 463 nm
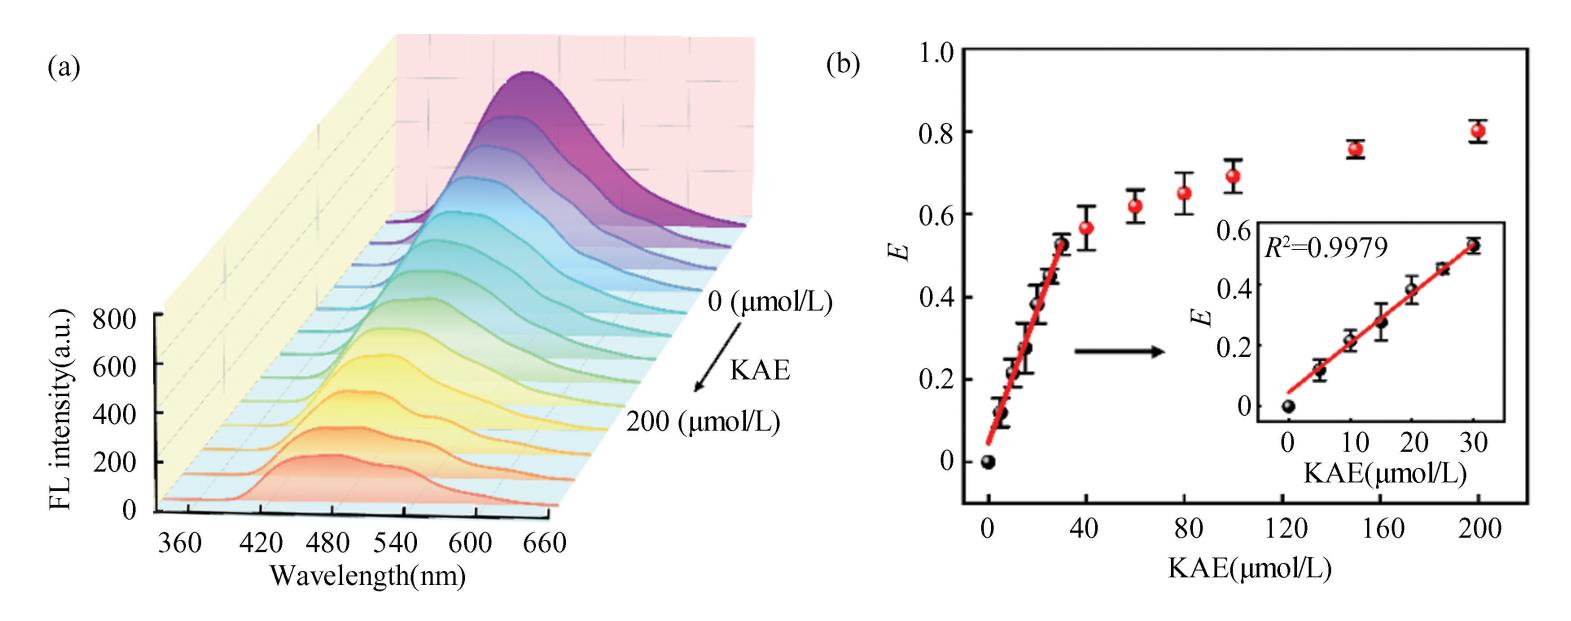
Fig.S3(a)Fluorescence emission spectra of FPD in PBS1-ethanol with increasing KAE concentrations;(b)Plot of fluorescence quenching efficiency versus KAE concentration
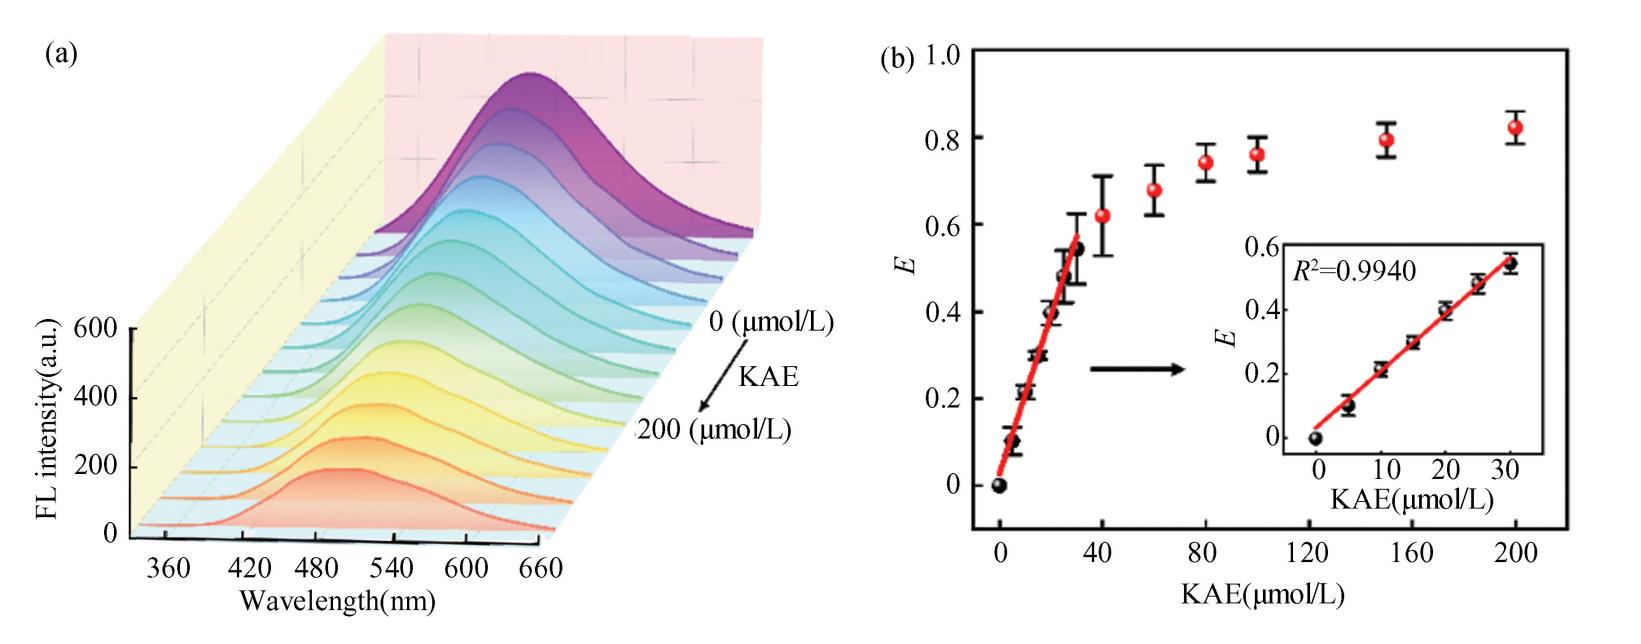
Fig.S4(a)Fluorescence emission spectra of FPD in PBS2-ethanol with increasing KAE concentrations;(b)Plot of fluorescence quenching efficiency versus KAE concentration
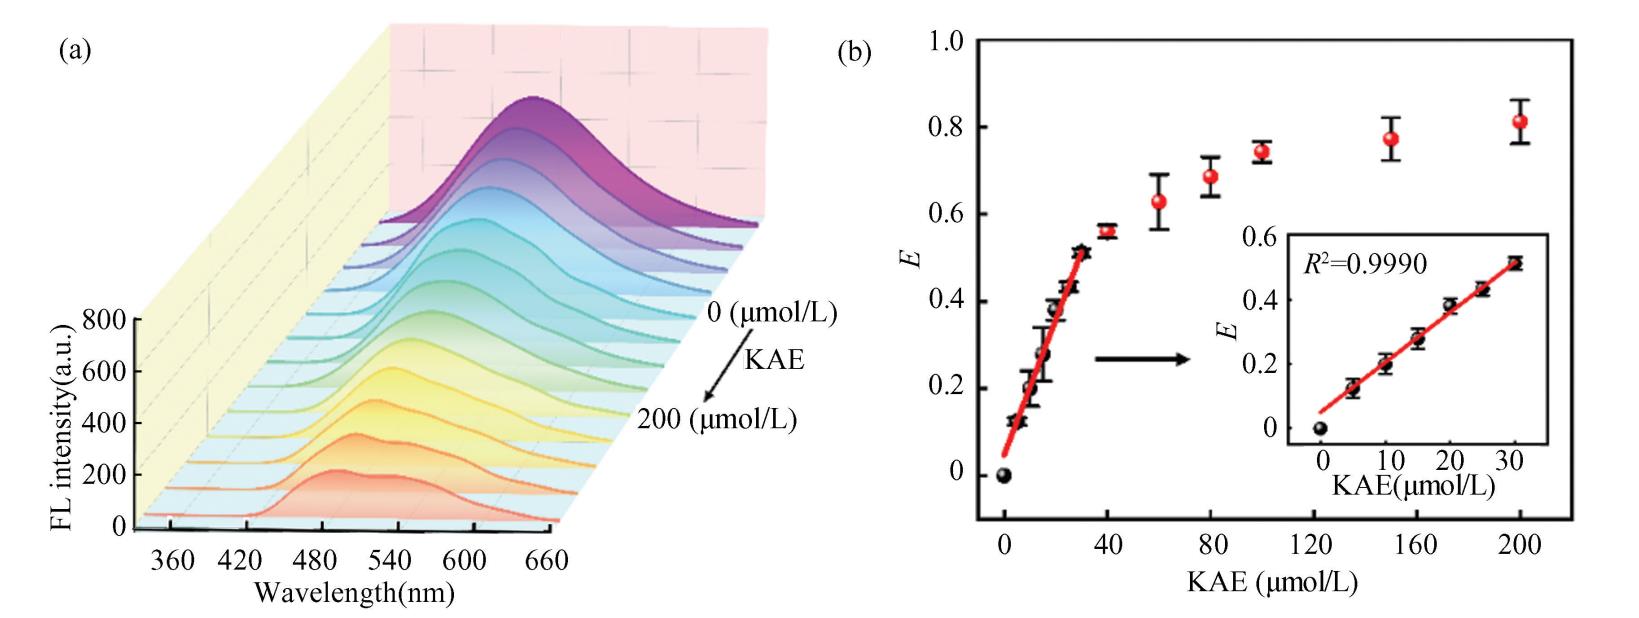
Fig. S5(a)Fluorescence emission spectra of FPD in PBS3-ethanol with increasing KAE concentrations;(b)Plot of fluorescence quenching efficiency versus KAE concentration)
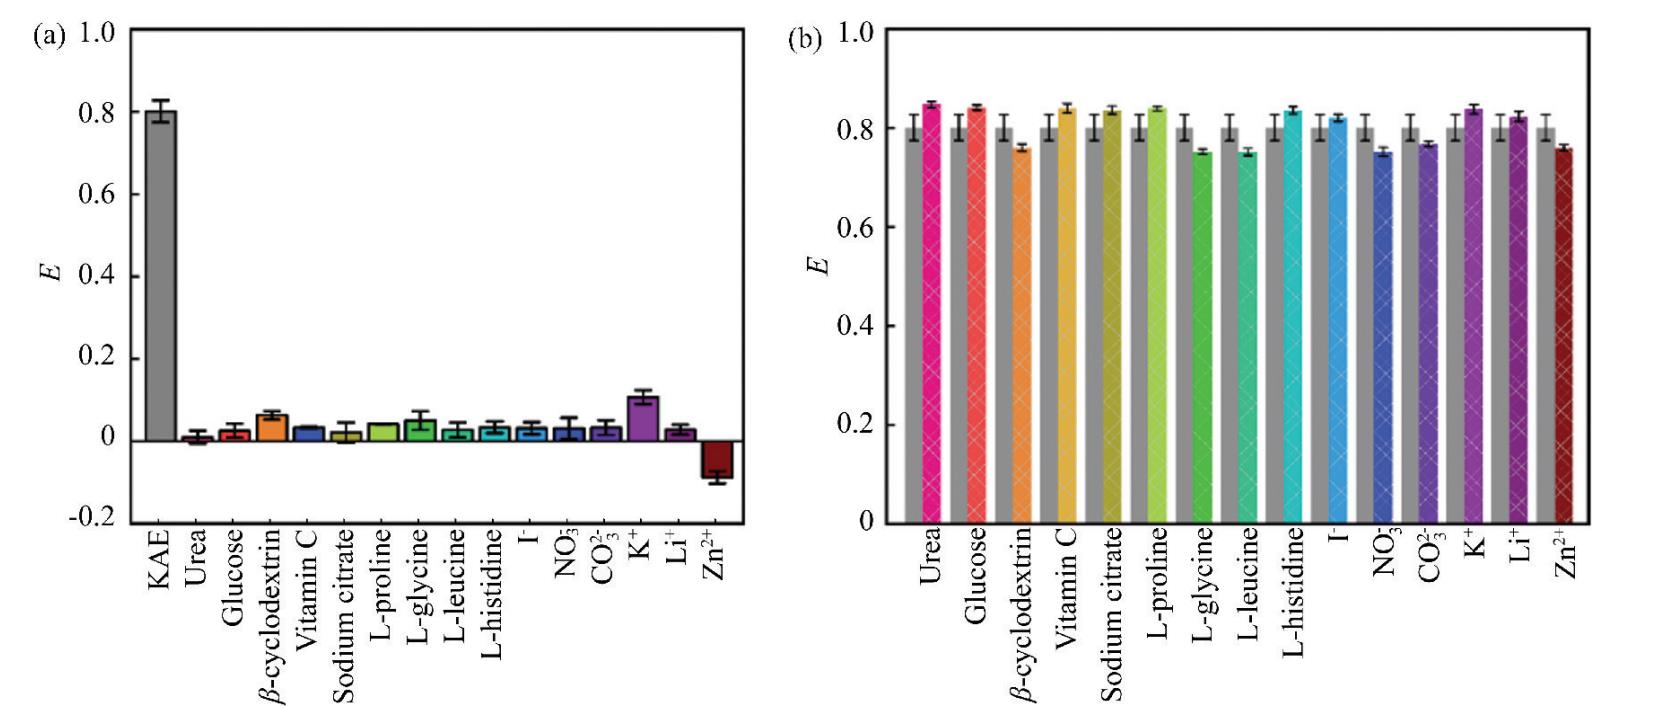
Fig. S6(a)Fluorescence response of FPD to different interfering substances in PBS1-ethanol;(b)Interference rate of KAE detected by FPD in PBS1-ethanol
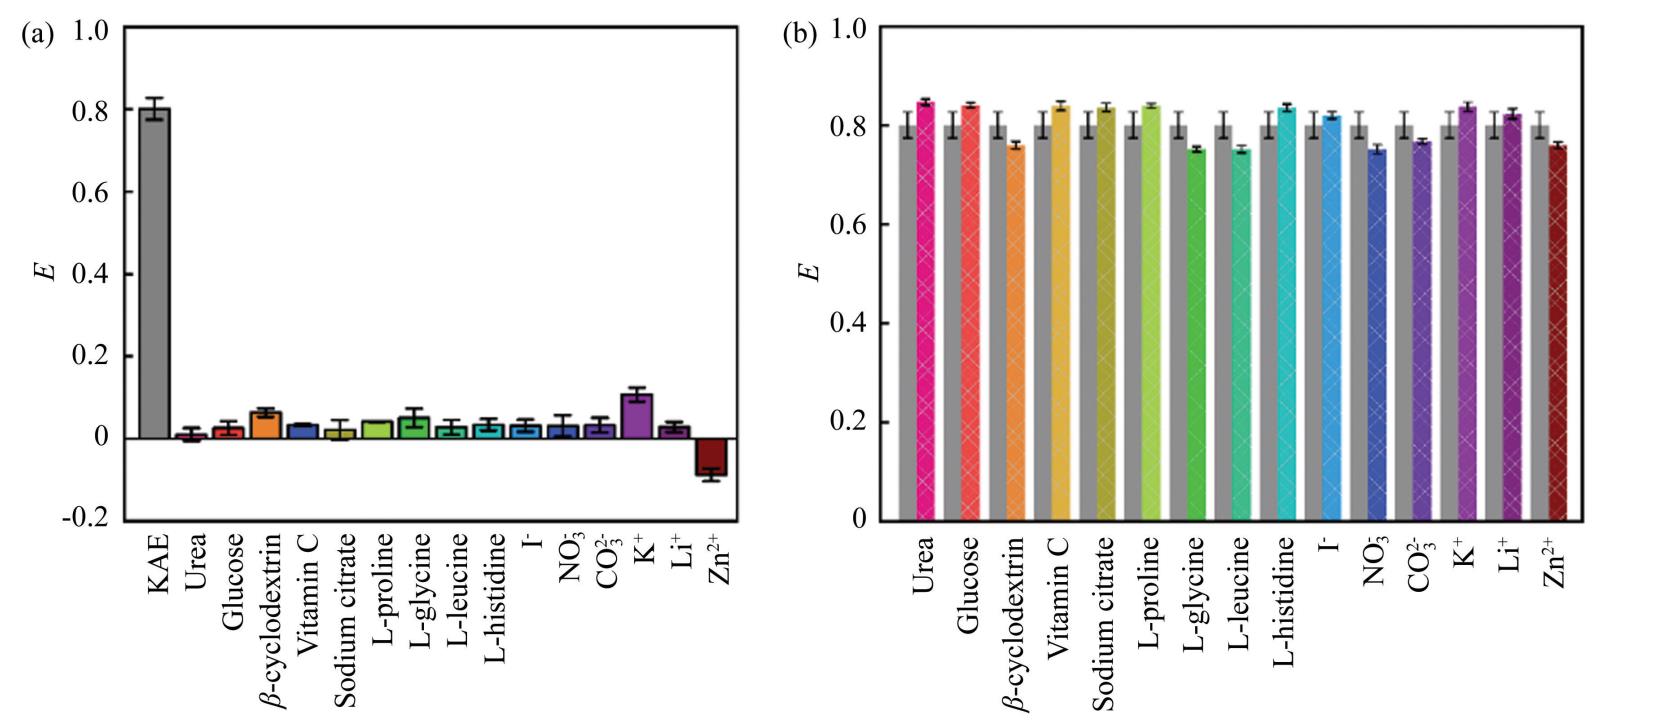
Fig.S7(a)Fluorescence response of FPD to different interfering substances in PBS2-ethanol;(b)Interference rate of KAE detected by FPD in PBS2-ethanol
In the PBS3-ethanol solvent,the fluorescence quenching efficiency of the interfering substances for FPD ranged from-2. 50% to 8. 10%,and the interference rate affecting the detection of KAE by FPD ranged from-5.44% to 10.55%
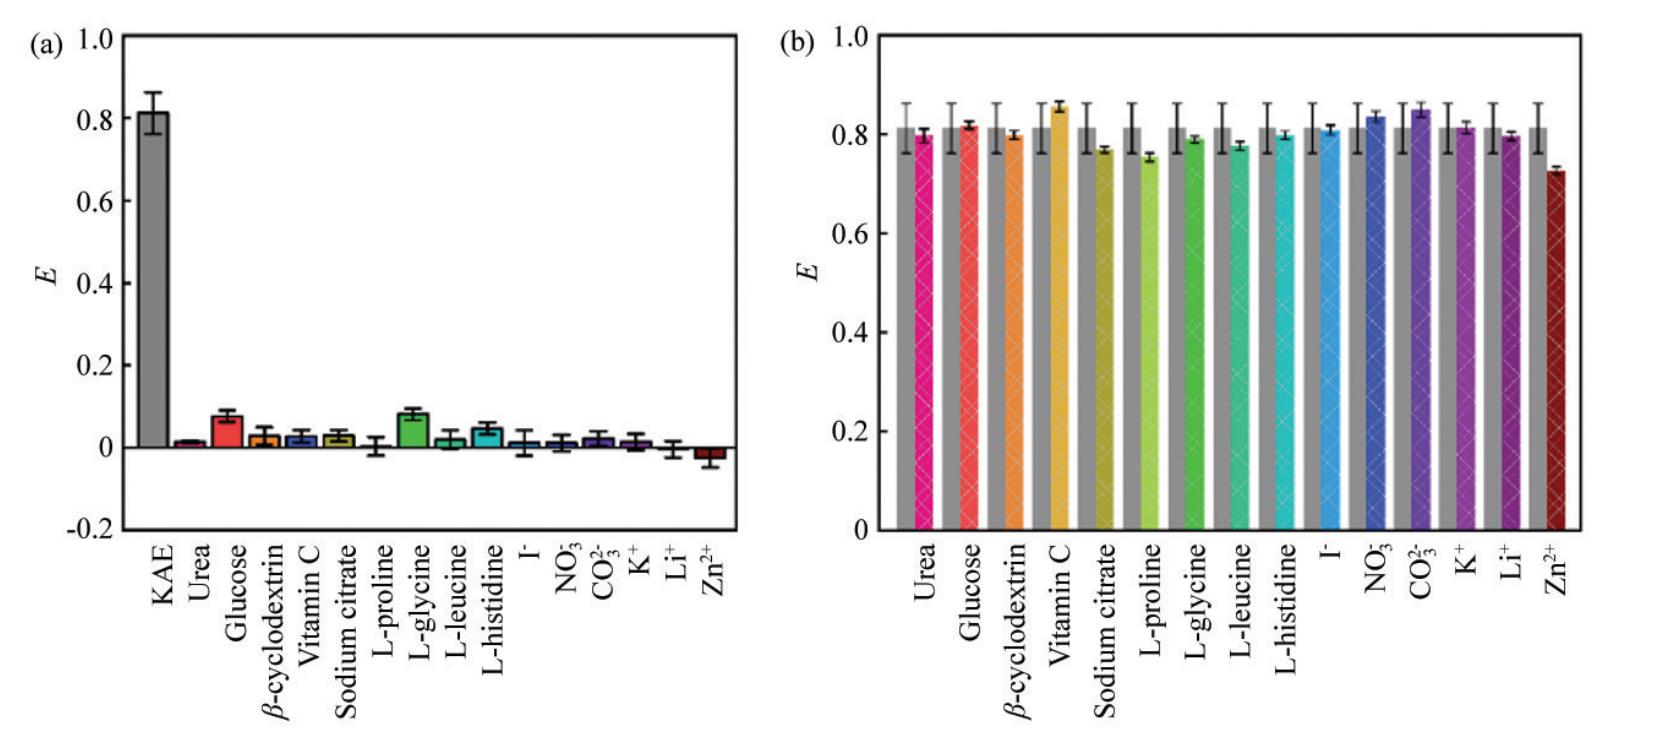
Fig.S8(a)Fluorescence response of FPD to different interfering substances in PBS3-ethanol;(b)Interference rate of KAE detected by FPD in PBS3-ethanol
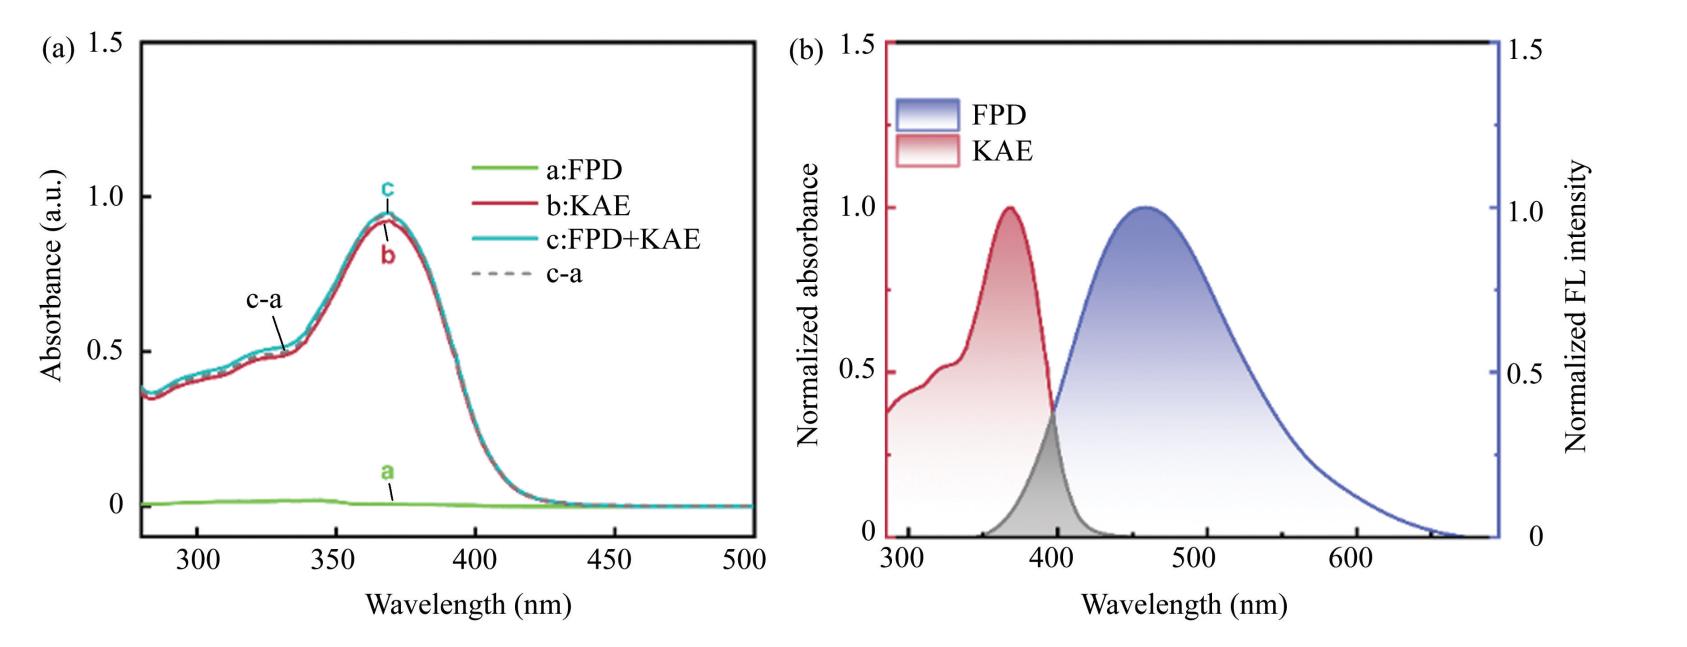
Fig. S9(a)Ultraviolet-visible spectrum after FPD and KAE interaction in PBS1-ethanol;(b)Normalized FPD fluorescence emission spectra and KAE UV-vis absorption spectra in PBS1-ethanol
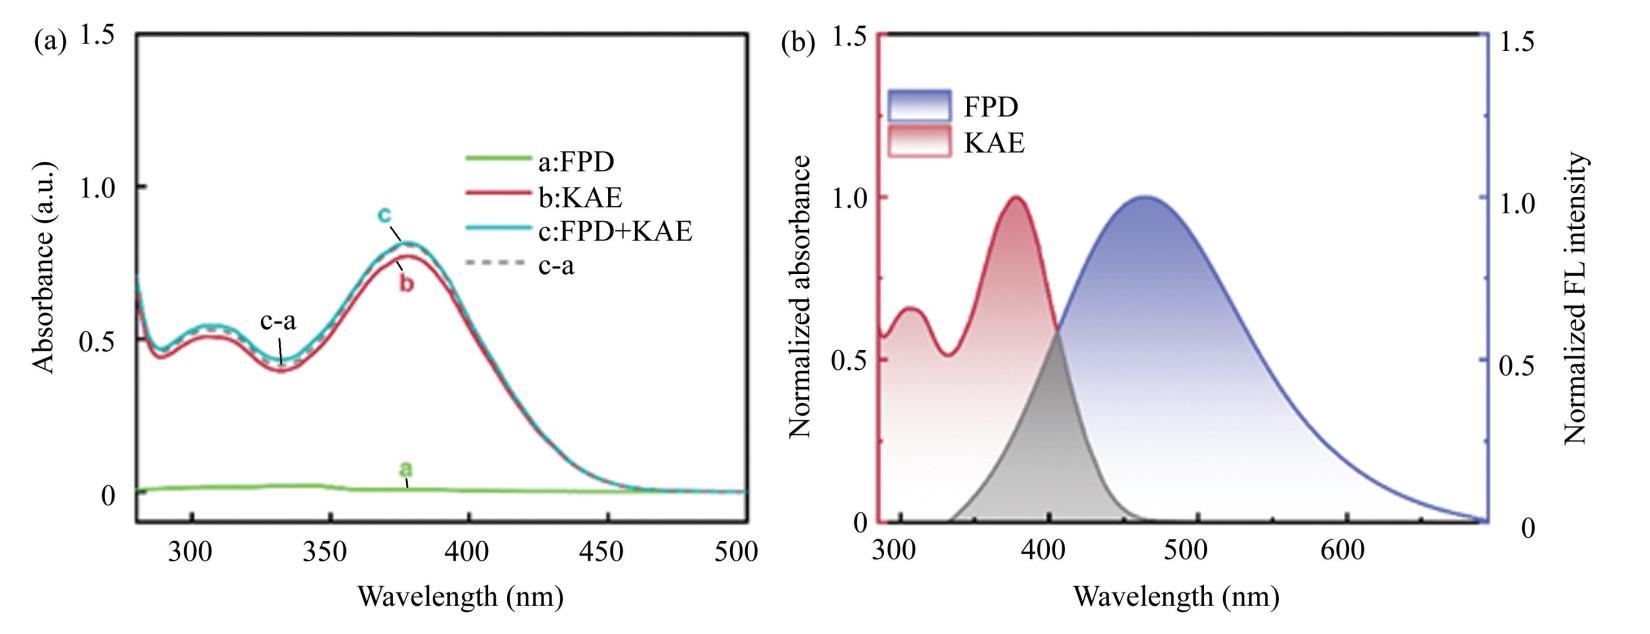
Fig. S10(a)Ultraviolet-visible spectrum after FPD and KAE interaction in PBS2-ethanol;(b)Normalized FPD fluorescence emission spectra and KAE UV-VIS absorption spectra in PBS2-ethanol
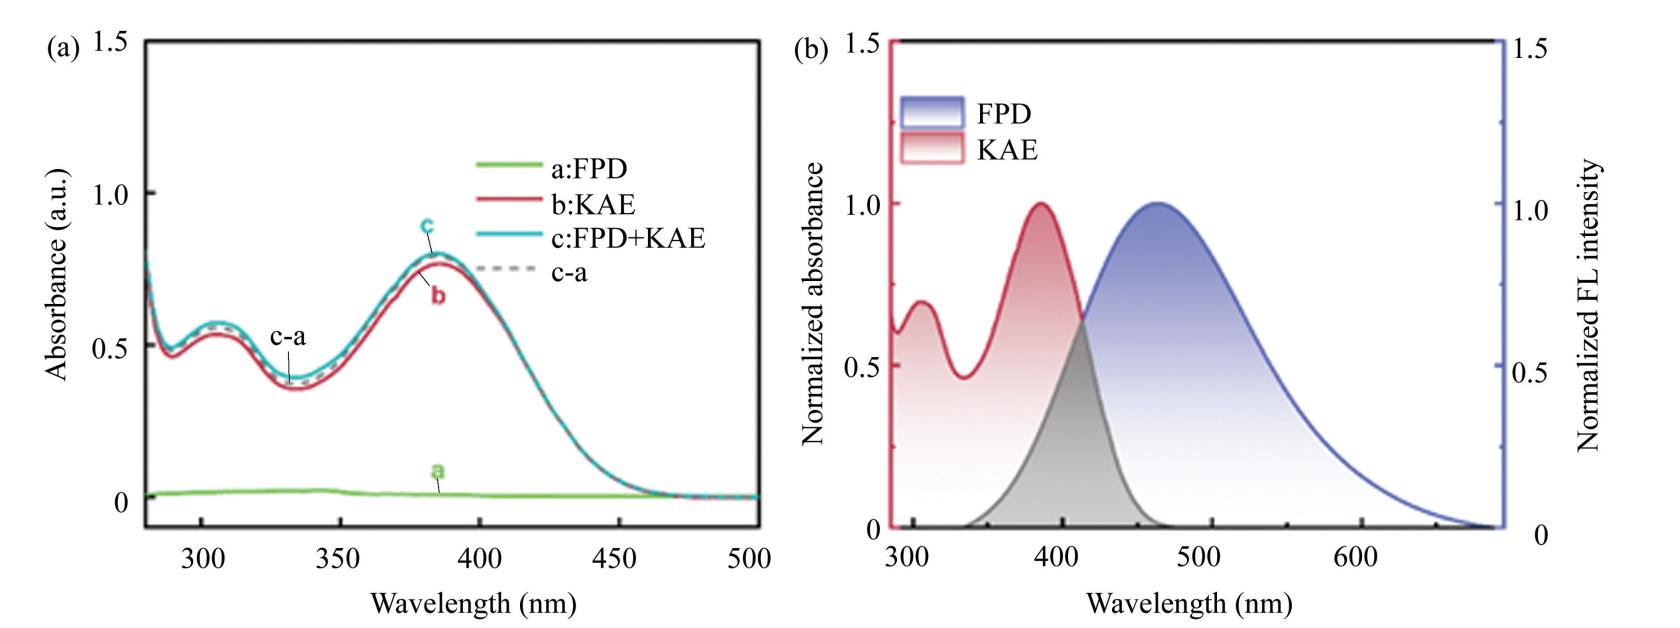
Fig. S11(a)Ultraviolet-visible spectrum after FPD and KAE interaction in PBS3-ethanol;(b)Normalized FPD fluorescence emission spectra and KAE UV-Vis absorption spectra in PBS3-ethanol
