Abstract
The assessment of materials' low-cycle fatigue (LCF)properties using micro-samples extracted from in-service structures is crucial for structural integrity evaluation. Existing small punch tests for low cycle fatigue (SPTLCF )methodologies predominantly rely on load-controlled approaches and remain constrained by dependencies on conventional standard round bar specimen data. To address this limitation,we propose a displacement-controlled (strain-controlled)SPTLCF framework. Firstly,a disc with center hole (Discch )specimen with dual mechanically fixed boundaries (inner and outer circular boundaries)is developed to enable symmetrical displacement-controlled cyclic loading. Then,a comprehensive theoretical framework is presented,including displacement-load model,equivalent stress-strain model,stress-strain field model,and maximum stress-strain model. Additionally,a new approach is proposed to determine material stress-strain relationships under cyclic steady states,coupled with a novel SPTLCF methodology for LCF performance assessment. Finite element analysis (FEA)of the specified materials demonstrates less than 4% deviation from model predictions. Experimental results of 316L stainless steel and P91 steel validate that the cyclic steady-state stress-strain relationships and the Manson-Coffin law derived from Discch specimens align closely with those from standard round bars.This study provides a reliable and material-efficient approach to evaluate LCF properties in metallic materials using miniaturized specimens,particularly for in-service structural applications.
Keywords
0 Introduction
In critical engineering domains such as aviation and nuclear power,due to the constraints imposed by the dimensions of service structural materials,the method of obtaining low cycle fatigue performance of materials using standard round bar specimens(measured in centimeters and decimeters)[1]is difficult to apply. Consequently,small sample fatigue testing technology for structural miniaturization has become a common trend.
Early studies indicated that straight thin sheet specimens are prone to cyclic instability when strain amplitudes exceed 0.2%-0.5%. To enhance specimen stability,Martin[2]proposed a constant-radius,funnel-shaped specimen design. Through geometric optimization,which equalized funnel curvature radius and root width,they achieved a nominal strain instability threshold of 1.5%. Wisner et al.[3]validated this design using zirconium alloy sheets,demonstrating effective instability suppression at strain amplitude below 1.41%.However,their life prediction method,which was based on mean strain and stress amplitude,contained a critical limitation:it neglected the stress concentration at the funnel root. This oversight led to deviation from the Manson-Coffin law derived from standard cylindrical specimens.
Addressing the equivalence challenge between thin sheet specimens and standard specimens,Huang et al.[4-5]proposed a lateral span displacement-controlled test method. Using finite element analysis(FEA),they derived equations to convert axial strain to nominal strain,achieving consistent low-cycle fatigue data between sheet and cylindrical specimens.However,the phenomenon of material cyclic hardening and softening during the cyclic process was not considered in the finite element analysis. Jia et al.[6]further minimized discrepancies with standard specimen results by incorporating cyclic stress-strain relationships in FEA. Yin et al.[7]introduced a semi-analytical method based on energy separation. This technique allowed them to derive the relationship between cyclic stress and strain directly from the relationship between load and displacement. This breakthrough enabled the prediction of low-cycle fatigue life for SS316L stainless steel by utilizing strain amplitudes of representative volume elements(RVE)at funnel roots. Theoretical validation was achieved through the energy density equivalence principles established by Chen and Cai[8-9]. Liu et al.[10-11]developed a theoretical framework for Martin-type specimens based on energy density equivalence and finite element analysis(FEA),characterizing the relationships among cyclic constitutive material parameters,geometric dimensions,displacement amplitude,and load amplitude.However,their theoretical model exhibited limited universality in terms of materials and geometry.Building on energy density equivalence and dimensional analysis,Zhang et al.[12-13]formulated analytical expressions for equivalent stress and equivalent strain at the median point of RVE energy density,represented by lateral displacement and load.They introduced a novel low-cycle fatigue testing approach using thin funnel specimens,which demonstrated broader applicability.
SPTLCF technology originated from experimental exploration of non-metallic materials. Villarraga et al.[14-15] were the first to perform load-controlled SPTLCF on polyethylene disks,establishing correlations among fatigue life,peak load,and hysteresis energy.Xiong et al.[16]analyzed the influence of experimental factors on fatigue behavior using alumina ceramic square specimens. With industrial demands,SPTLCF research shifted to metallic materials. Prakash et al.[17]used FEA to identify that the maximum stress under cyclic loading concentrates within a region one-fifth of the punch diameter in disk specimens. They proposed corrections for simulated fatigue life and defined failure based on surges in hysteresis energy. Lancaster et al.[18]designed a dual-punch system for symmetric cyclic loading. Subsequent studies on disk specimens under various loading ratios demonstrated consistent damage mechanisms between SPTLCF and uniaxial fatigue tests. By integrating FEA with empirical correlation methods,relationships between maximum principal stress and fatigue life were established at a stress ratio of 0.1. Nonetheless,the empirical basis of these correlations limited their theoretical robustness[19-20]. Komazaki et al.[21-22]employed a hydraulic test chamber to apply symmetric stress cycling on indented circular specimens,defining failure criteria as either a drop in hydraulic pressure or through-thickness cracking. Due to challenges in measuring critical strain,using average strain values for life prediction introduced bias.
Recent research has focused on developing life prediction frameworks for SPTLCF. Zhao et al.[23]conducted high-temperature load cycling tests on circular specimens with a loading ratio of 0. 1. By substituting stress-related parameters with corresponding load parameters,they evaluated the applicability of conventional life prediction models to SPTLCF data. In the same year,Lu[24]proposed a critical-plane energy parameter method for load-controlled SPTLCF at a loading ratio of 0.1,achieving relatively accurate,albeit conservative,predictions.Otero et al.[25]developed an SPTLCF methodology using square specimens,correlating compliance increments with damage progression under load-controlled conditions with a loading ratio of 0.1. They introduced a correlation coefficient 𝑘SPT between SPTLCF and rotating beam fatigue limits,accounting for specimen dimensions and stress distributions. Kim et al.[26]performed symmetric load-controlled SPTLCF simulations on square sheets using a modified Wahab damage model. By converting maximum loads into equivalent stresses,they derived S-N curves and validated the reliability of SPTLCF through comparison with uniaxial data. Pandey et al.[27]systematically examined the effects of load and stress parameters on ratcheting behavior in load-controlled SPTLCF under a stress ratio of 0. 1. Leveraging three established life prediction models—Gerber,Goodman,and Smith-Watson-Topper—they proposed new damage parameters to correlate ratcheting effects in SPTLCF with uniaxial fatigue test results.
Currently,most SPTLCF methods focus on load-controlled conditions,with life predictions largely dependent on uniaxial data and lacking rigorous theoretical foundations. Moreover,the implementation of strain-controlled SPTLCF still faces critical limitations.
To address the research gap in strain-controlled small punch testing for low-cycle fatigue,this study designed a disc specimen with a center hole(Discch )capable of displacement-controlled(i. e.,strain-controlled)loading,along with a corresponding clamping system. Based on the energy density equivalence principle and validated by FEA,a theoretical framework was established comprising:1)theoretical models for load-displacement and stress-strain relationships,and 2)a semi-analytical model characterizing stress-strain fields and maximum stress-strain values. The framework was calibrated and validated through FEA. Furthermore,novel methods were proposed for obtaining material cyclic stress-strain relationships and implementing strain-controlled small punch fatigue testing. The reliability of these methods was confirmed via comparative analysis between cyclic small punch tests on P91 and 316L materials and standard uniaxial test results.
1 Experiment Setup
1.1 Finite Element Analysis Conditions
The schematic illustration in Fig.1 depicts the Discch specimen and the associated SPTLCF test setup.The critical geometrical parameters are defined as follows:𝑅d denotes the inner diameter of the central aperture in the annular specimen,𝑟 represents the radial distance measured from the punch clamping interface,𝐵 corresponds to the axial thickness of the specimen,and 𝐿 specifies the effective clamping length between the punch termination point and the specimen-gripping region. It should be noted that both upper and lower fixtures maintain identical punching configurations,ensuring symmetrical loading conditions during experimental operations.
As highlighted in the red box in Fig.1,the clamping end behaves analogously to a cantilever beam. Stress analysis reveals that the supported regions on the upper and lower surfaces of the fixed end are dominated by normal stress:the upper surface is subjected to maximum tensile stress,while the lower surface experiences maximum compressive stress,both of equal magnitude. Near the fixed end,the shear stress component becomes negligible,rendering the von Mises equivalent stress equal in magnitude to the principal stress. This uniaxial stress state provides a theoretical basis for employing the local stress-strain method to determine the equivalent stress and strain amplitudes under cyclic steady-state conditions. Moreover,during cyclic loading,the specimen end in contact with the punch undergoes uniaxial proportional loading,and the stress evolution at the critical failure point exhibits characteristic features of uniaxial loading.
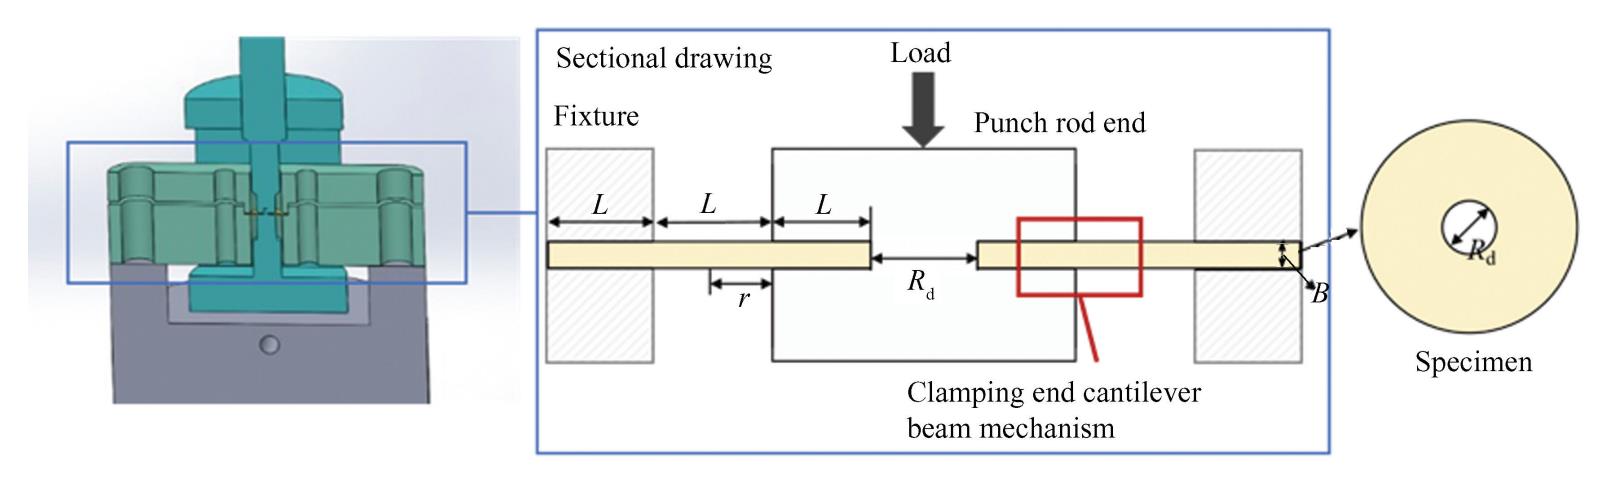
Fig.
1
Schematic representation of the Discch specimen and SPTLCF fixture system
FEA was conducted in ANSYS 19.2 to simulate the mechanical response of Discch specimens under monotonic loading. The material was modeled as homogeneous,isotropic,and following an isotropic hardening rule,with a Poisson’ s ratio of 0. 3. The mesh was discretized using PLANE 182 elements,selected for their suitability in axisymmetric simulations. To accurately resolve stress concentrations and deformation gradients,local mesh refinement was applied in the contact regions between the specimen and the punch. The punch rod was modeled as a rigid body with TARGE 169 elements,and the contact interfaces between the Discch specimen and the upper and lower fixtures were represented using CONTA172 flexible contact elements,forming contact pairs to simulate mechanical interaction. Boundary conditions were assigned to replicate experimental constraints:axisymmetric conditions were applied to the left and bottom edges of the model,while the upper and lower fixtures were fully fixed(𝑋= 0,𝑌= 0)to mimic clamping. A friction coefficient of 0.15 was defined at the punch-specimen contact interface to account for surface interactions. The mesh configuration result is depicted in Fig.2.
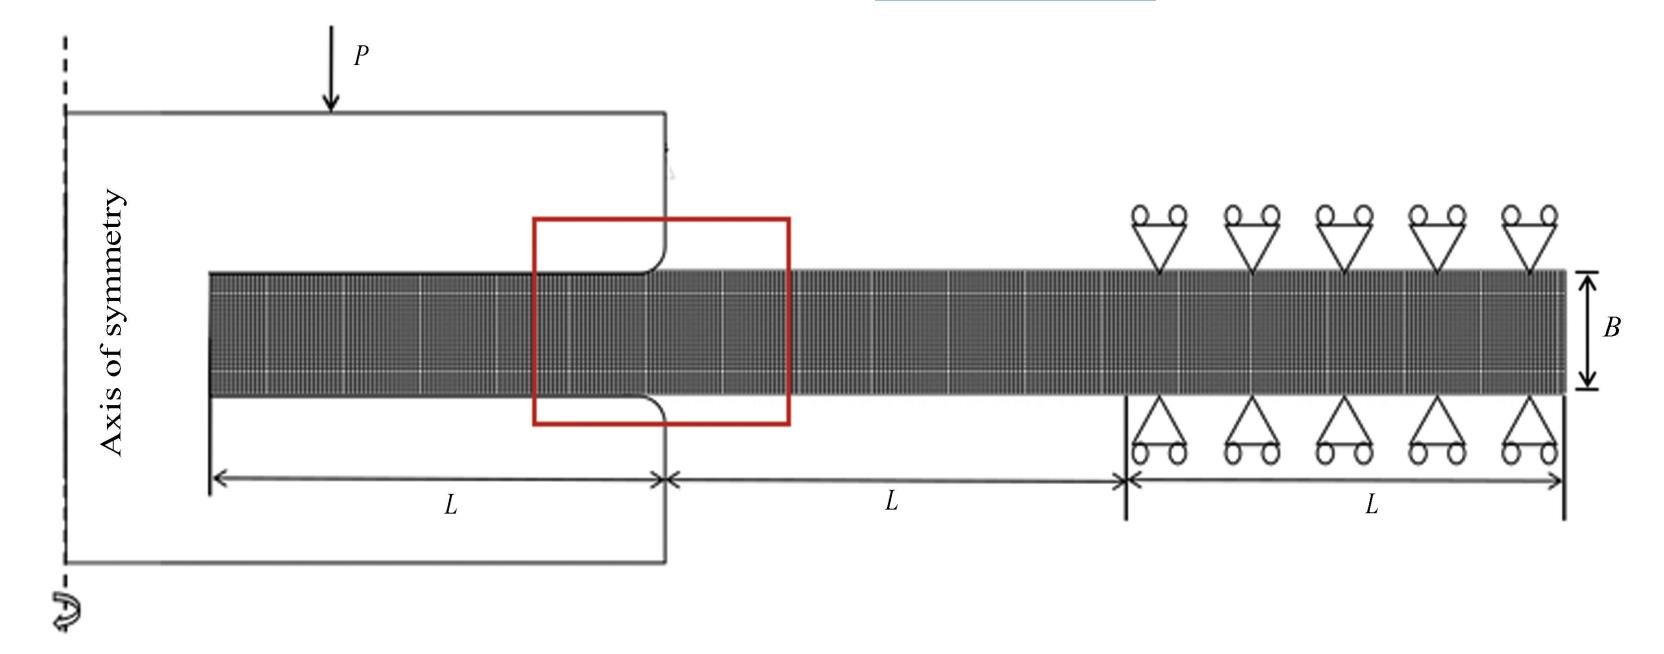
Fig.
2
Discch specimen symmetric mesh model
To investigate the influence of mesh density on FEA results and to establish an optimal mesh configuration that ensures computational convergence,a comprehensive finite element analysis was performed on H-law materials with the following mechanical properties:Young's modulus 𝐸=200 GPa,Hardening index 𝑛= 0.2,and yield strength 𝜎y= 400 MPa. Fig. 3 presents the load-displacement responses and equivalent stress distributions under different mesh densities,showing converged results for densities of 1,2,and 4. To optimize computational efficiency while maintaining solution accuracy and enabling high-resolution contour plot analysis,a mesh density of 2 was selected for detailed analysis,comprising a total of 363 84 elements.
1.2 Test Conditions
The geometric dimensions of sample and punch end are illustrated in Fig. 4. As shown in Fig. 4(a),the central-hole disc specimen has an inner diameter of 2.0 mm,an outer diameter of 14.0 mm,and a thickness of 0.5 mm. Fig.4(b)presents the dimensional parameters of the punch end configuration. The contact surfaces between the specimen and both the upper and lower punches have a diameter of 5.6 mm. The edges of the contact regions are designed with a fillet radius of 0.5 mm and a transition zone width of 0.2 mm.
Fig.5illustrates the clamping system for the central-hole disc specimen. The system primarily comprises two assemblies:1)a fixed strip set,as shown in Fig. 5(a),which clamps the outer circumferential edge of the specimen;and 2)upper and lower punch rods combined with a loading connector,as shown in Fig. 5(b),which clamp the inner hole edge of the specimen.
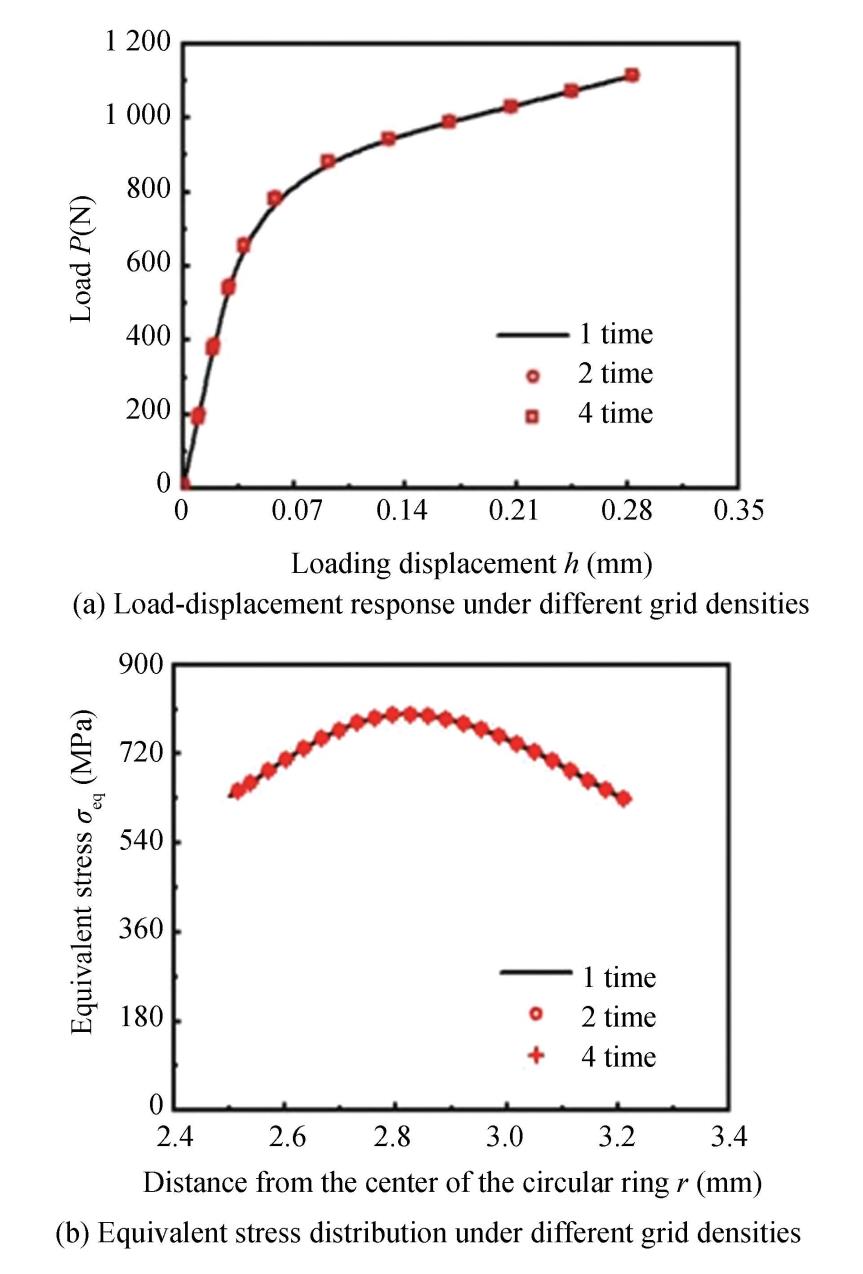
Fig.
3
Influence of grid density on FEA results
The outer circumferential edge of the specimen 5is secured within a sample cavity between the upper 3and lower 4 fixed strips,with a radial clamping width of 2 mm. The cavity has a diameter of 14 mm and a height of 3 mm. The assembled fixed strip pair is inserted into the loading connector,while the upper 1and lower 2 punch rods pass through it. The opposing ends of the punch rods contact the upper and lower surfaces of the specimen,respectively,clamping the inner hole periphery with a radial width of 2 mm.
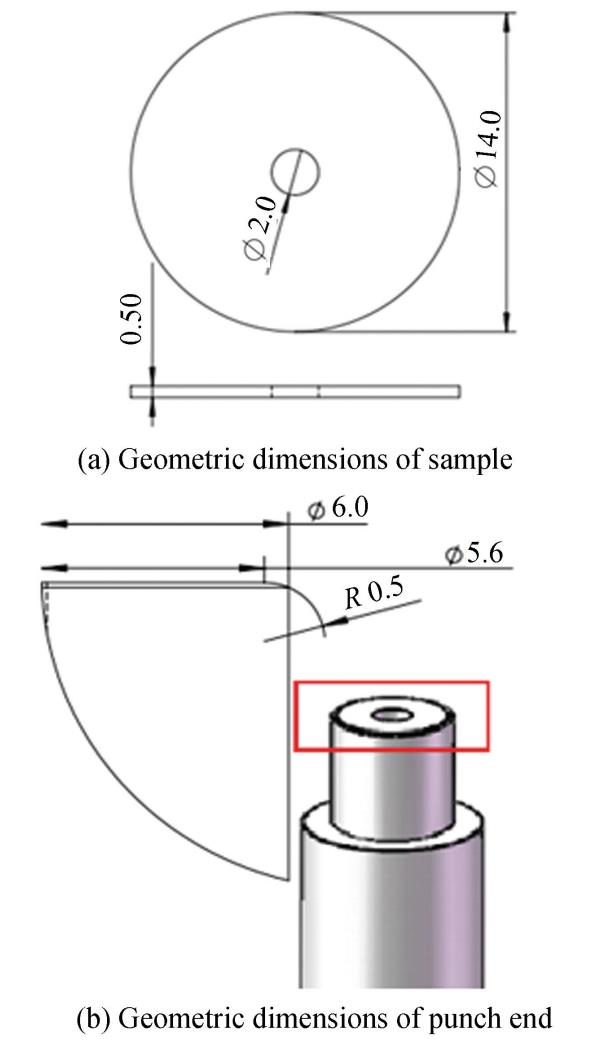
Fig.
4
Geometric dimensions of sample and punch end (Unit:mm)
The upper and lower punch rods are fastened via the loading connector 6. The fixed strip pair is bolted to the lower clamp of the testing machine 7,and the upper punch rod is connected to the upper clamp 8 to allow vertical movement. Relative displacement between the punch rods and the fixed strip pair introduces controlled displacement at both the inner hole periphery and the outer circumferential clamping regions. This setup enables displacement-controlled cyclic loading of the central-hole disc specimen,with the relative displacement measured by a strain extensometer 9.
To validate the uniqueness of stress-strain relationship for metallic materials under cyclically stable conditions and to assess the applicability of the novel SPTLCF method,a series of multi-stage symmetric cyclic displacement-controlled small punch tests(SPT)were performed on Discch specimens. The experimental results were compared to the results of corresponding standard round bar specimens. The SPTLCF were conducted using a Gouyuan testing system,manufactured by Chengdu Miniature Mechanical Testing Science & Technology Co.,Ltd.(MMTS). The load sensor of the equipment has a capacity of ±5 kN. Displacement control was achieved using an MTS32.29F-30 strain extensometer with a gauge length of 5 mm and a range of-10% to30%. All tests were performed under a loading ratio of 𝑅=-1.
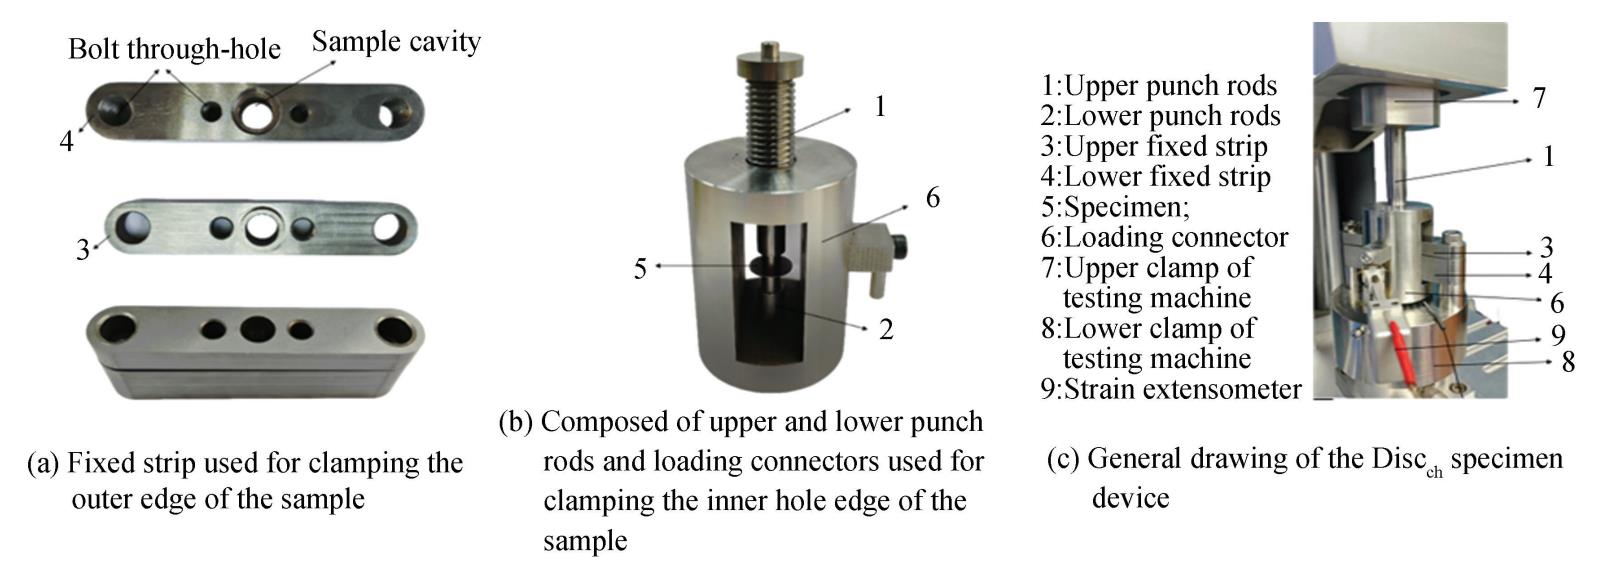
Fig.
5
Discch specimen clamping system
2 Theoretical Model
2.1 Load-Displacement Model
The elastoplastic stress-strain relationship for commonly used engineering metals is frequently modeled by the H-law model,expressed as follows:
(1)
where,𝜀eq and 𝜎eq represent the equivalent strain and stress,respectively. 𝜀y is yield strain;𝐸 denotes the elastic modulus,𝑛 is the strain hardening index,and 𝐾,the strain hardening coefficient,is defined as 𝐾=
For a homogeneous and isotropic solid under uniaxial loading,the relationship between median energy density and total deformation energy is given as follows[28-29]:
(2)
here,𝑉eff is the effective deformation volume,𝑢C the energy density at the midpoint C of the representative volume element(RVEC),𝜎eq⁃C the equivalent stress of RVEC under specific loading conditions,and εeq-C the equivalent strain of RVEC.
Combined with the H-law Eq.(1)and Eq.(2),the strain energy density of RVEC is calculated as follows:
(3)
Under large deformation conditions,𝜀y is relatively small compared to 𝜀eq⁃C,as demonstrated in Eq.(4):
(4)
Simplifies Eq.(3)into Eq.(5).
(5)
Under the application of load 𝑃,when a solid specimen undergoes a displacement ℎ∗ along the loading axis at the loaded position,both 𝑉∗ and 𝜀eq⁃C exhibit co-varying adjustments. The characteristic volume 𝑉∗,characteristic area 𝐴∗,and characteristic geometric dimension h∗are defined to satisfy the relationship:𝑉∗= 𝐴∗ℎ∗and it is hypothesized that both 𝜀eq⁃C and 𝑉eff/ 𝑉∗ follow power-law relationships with ℎ/ ℎ∗:
(6)
where 𝑘1 and 𝑘₂ are the effective deformation volume coefficient and index,respectively;𝑘₃ and 𝑘₄ are the equivalent deformation coefficient and index,respectively;𝑝₁and 𝑝₂ are effective deformation volume correction parameters.
Under quasi-static loading conditions,energy conservation implies that the work W done by the external load on the specimen equals the total deformation energy 𝑈,
(7)
According to Eq.(6),both 𝑉eff and 𝑢C are functions of the 𝑉 and ℎ. Through application of the differentiation operator with respect to ℎ on both members of Eq.(7),𝑃 can be described as follows:
(8)
We solve Eq.(6)in conjunction with Eqs.(5)and(1),resulting in the following integral expression for 𝑢C:
(9)
Substituting 𝑢C from Eq.(5)and 𝑉eff from Eq.(6)into the first term on the right-hand side of Eq.(8),and similarly substituting 𝑢C from Eq.(9)and 𝑉eff from Eq.(6)into the second term,yields,
(10)
Rearranging the above formula yields Eq.(11):
(11)
where, 𝐶 and 𝑚 serve as the loading coefficient and index,respectively,for the second stage of the load-displacement curve during SPTLCF for the Discch model,and 𝑃∗ represents the characteristic load. This equation encapsulates the relationship between the H-law parameters,geometric dimensions,and the load and displacement of the Discch specimen,called as load-displacement model.
2.2 Equivalent Stress and Strain Model
Utilizing Eqs.(10)and(6),equivalent stress and strain for the RVEC are derived as follows:
(12)
where 𝑘₅ and 𝑘₆ are the equivalent stress coefficient and index,respectively. 𝑘₅= [𝑘₁𝑘₃(𝑘₄+𝑘₂/(𝑛+1))]-1,𝑘₆= 1-𝑘₂-𝑘₄,𝑘₁= p₁+ p₂𝜀y. Eq.(12)delineates the relationship among equivalent stress and strain of RVEC,the load,displacement,geometric dimensions,and material hardening index of the specimen,designated as the equivalent stress and strain model.
2.3 Experimental Method for Obtaining H Law Parameters of Discch
The loading index 𝑚 and coefficient 𝐶 are determined through a regression analysis of the second stage loading-displacement curve of the Discch specimen in SPTLCF,expressed as 𝑃/ 𝑃∗= 𝐶(ℎ/ ℎ∗)𝑚. From Eqs.(11)and(1),we derive the solution for the H-law parameters 𝑛,𝐾,and 𝜎𝑦.
(13)
2.4 Stress and Strain Fields Model
Using dimensional analysis,the stress and strain distributions near the punch's clamping end are described by Eq.(14)below[30],with 𝜎eq⁃C and 𝜀eq⁃C representing the characteristic stress(𝜎C)and strain(𝜀C).
(14)
where 𝜎C and 𝜀C contain the load 𝑃,loading displacement ℎ,hardening index 𝑛,𝗀 (𝑟/ 𝑅d,𝑛,𝜎y/ 𝐸)and 𝑓(𝑟/ 𝑅d,𝑛,𝜎y/ 𝐸)contain the distance 𝑟 from the punch clamping endpoint and material parameters(elastic modulus 𝐸,strain hardening index 𝑛,yield stress 𝜎y). 𝑅d is the inner diameter of the mesoporous circular specimen.
To effectively characterize the distinctive distribution characteristics of the stress and strain fields in Discch specimens under cyclic loading,a trigonometric function form is adopted in this study to construct the constitutive relation. Compared to other forms,such as polynomials and exponentials,the trigonometric function offers higher parameter sensitivity and better operational tolerance when fitting field distributions. It allows flexible adaptation to variations in load response under different materials and displacement conditions through adjustments of parameters such as amplitude and frequency.Moreover,the incorporation of a constant term enables the representation of non-zero mean or notable bias characteristics in the distribution of stress and strain fields,thereby providing a more accurate description of their physical nature. Functions 𝑓 and 𝗀 are assumed as follows:
(15)
where 𝑎k(𝑘= 1,2,3)and 𝑐𝑠(𝑠= 1,2,3)represent the dimensionless parameters related to material parameters. Eqs.(14)and(15)elucidate the relationship between the equivalent stress and strain at different positions within the Discch specimen and its associated load,displacement,geometric dimensions,material parameters,and distance from the punch clamping endpoint,known as stress and strain fields model.
2.5 Maximum Stress and Strain Model
The sample is clamped between the upper and lower punch clamps for loading. As highlighted in the red box in Fig.2,the mechanism at the clamping end functions similarly to a cantilever beam. Mechanical analysis and FEA results indicate that the stress and strain values peak at the clamping end. By setting 𝑟/ 𝑅d=0 in the stress and strain field equations(Eqs.(14)and(15)),the maximum stress 𝜎eq⁃max and maximum strain 𝜀eq⁃max are obtained as follows:
(16)
Under the applied load 𝑃,integrating Eqs.(12)and(16)establishes the following relationships:
(17)
where 𝛽₁ and 𝛽₂ are the maximum stress and maximum strain coefficient,respectively. 𝑘₅= [𝑘₁𝑘₃(𝑘₄+𝑘₂/(𝑛+ 1))]-1,𝑘₆= 1-𝑘₂-𝑘₄,𝛽₁=(1+ 𝑎₃)𝑘₅,𝛽₂=𝑐₁𝑘₃. Eq.(17)clarifies the relationship between the maximum stress,maximum strain of the Discch specimen,and the loading displacement,load,and material parameters,referred to as the maximum stress and strain model. This relationship is essential for converting SPTLCF displacement and load data into maximum stress and strain,thereby defining the model for maximum stress and strain in the Discch specimen. In the cyclic loading state,the maximum stress and strain of the specimen represent the stress amplitude and strain amplitude at the failure point.This model facilitates the conversion of the load amplitude 𝑃a and the axial displacement amplitude ℎa at the center of the sample to the stress amplitude 𝜎eq⁃a and strain amplitude 𝜀eq⁃a at the failure point under low cycle loading.
2.6 Equivalent Stress-Equivalent Strain Relationship of Cyclic Steady State
In the steady-state strain cycle,for metal materials that adhere to the Masing effect,the cyclic steady stress amplitude 𝜎a and strain amplitude 𝜀a can represent the uniaxial stress-strain behavior of materials under cyclic stability. For metals that do not conform to the Masing effect,𝜎a-𝜀a can still be used as an approximate measure. Variables such as the load amplitude 𝑃a,the axial displacement amplitude ha at the center of the specimen,the cyclic equivalent stress amplitude 𝜎eq⁃C⁃a,and the cyclic equivalent strain amplitude 𝜀eq⁃C⁃a,replace the respective variables 𝑃,ℎ,𝜎eq⁃C,𝜀eq⁃C in Eq.(12). Theoretical equations for the cyclic equivalent stress amplitude and equivalent strain amplitude for the RVEC,represented by the axial displacement amplitude at the center of the specimen and the load amplitude under elastic-plastic conditions,can be derived.
(18)
where
Using the symmetric strain cyclic test under different displacement amplitudes as examples,the stress amplitude-strain amplitude relationship for materials in steady-state cyclic conditions can be directly obtained through the axial displacement amplitude at the center of the specimen and the load amplitude. This method involves collecting and processing data,where the center axial displacement-load hysteresis loop of the sample for each controlled displacement amplitude level is recorded.Consequently,the load amplitude and the center axial displacement amplitude data(𝑃a,ℎa)corresponding to each displacement amplitude level are obtained.The cyclic equivalent stress amplitude and strain amplitude under elastic-plastic conditions are calculated using Eq.(18). Additionally,the expressions for the cyclic strain strengthening index 𝑛′and the cyclic strain strengthening coefficient 𝐾′ of the cyclic stress-strain relationship can be derived from Eq.(12). Ultimately,from the theoretical equations of cyclic equivalent stress amplitude and equivalent strain amplitude,the data(𝜎eq⁃C⁃a,𝜀eq⁃C⁃a)for the RVEC can be obtained,presenting the relationship between equivalent stress amplitude and equivalent strain amplitude when the material is cyclically stable.
3 Parameters Calibration
3.1 Parameters Calibration of Load-Displacement Model
Before calibrating the model parameters,it is essential to select appropriate characteristic areas 𝐴∗ and characteristic displacements ℎ∗ to mitigate the impact of scale effects on the results.This overlap of the normalized responses,𝑃/ 𝑃∗-ℎ/ ℎ∗ is achieved when testing geometrically similar specimens whose dimensions satisfy the ratio 𝐿= 4𝐵. FEA has established the optimal characteristic parameters for the Discch specimen as a characteristic displacement of ℎ∗= 𝐵 and a characteristic area of 𝐴∗= 3BL.
The elastic modulus 𝐸 of the material used for the Discch specimen was set at 200 GPa. The yield stress σy ranged from 200 MPa to 1 000 MPa,with increments of 200 MPa,and the strain hardening index 𝑛 varied from 0.1 to 0.4,with a step size of 0.1.Through FEA,load-displacement responses for twenty combinations of constitutive parameters 𝜎y and 𝑛 were acquired. Subsequent power law fitting of the second stage establishes relationships between different parameters 𝑚,𝐶 and the hardening index 𝑛.According to the load-displacement model of Eq.(11),during the regression analysis,it was observed that the effective deformation volume coefficient 𝑘₁ exhibited significant dispersion in materials with varying yield strains 𝜀y. To address this issue,a modified formulation was proposed in Eq.(19)for systematic correction.
(19)
By substituting the modified formulation from Eq.(19)into the original theoretical framework of Eq.(11),the complete theoretical model for the load-displacement relationship can be derived as:
(20)
where p₁ and p₂ are the correction parameters of effective deformation volume coefficient. The model parameters p₁,p₂,𝑘₃-k₅ corresponding to the Discch specimen are obtained,as shown in Table 1.
Table
1
Parameter values of load-displacement model

Note:All parameters are dimensionless.
It should be noted that during the process of deriving the load-displacement model from Eq.(4),the approximation of small quantities(1-n)/ 2 ·(εy/ 𝜀eq⁃C)¹⁺𝑛 are neglected so that slight deviations may be exhibited in predicting load-displacement,𝑛,and 𝐾. Hence,there is a minor discrepancy between the loading index 𝑚 calculated directly from Eq.(11)and the loading index 𝑚𝑡 fitted in the second stage of the load-displacement curve. It is recommended to adjust the loading index by the yield strain 𝜀y,
(21)
where p₃-p₅ denote correction parameters,and the corrected parameter values are listed in Table 2.
Table
2
𝑚𝑡 correction parameters

Note:All parameters are dimensionless.
3.2 Parameter Calibration of Stress-Strain Field Model
Through finite element analysis and mathematical analysis,the relationship between material parameters and 𝑎𝑘,𝑐𝑠 satisfies the following equation:
(22)
Here,𝑏𝑘𝑗,𝑗 = 1-5,𝑑𝑠𝑡,𝑡 = 1-5 are constants of the equivalent transformation theoretical model for stress and strain distribution. By combining Eqs.(14)and(15),the complete expression of the equivalent transformation theoretical model for maximum stress(amplitude)and strain(amplitude)can be derived as:
(23)
where 𝑘₅= [𝑘₁𝑘₃(𝑘₄+ 𝑘₂/(𝑛+ 1))]-1,𝑘₆= 1-𝑘₂-𝑘₄,𝑘₁= p₁+ p₂εy,𝛽₁=(1+ 𝑎₃)𝑘₅,𝛽₂= 𝑐₁𝑘₃,𝑎𝑘=
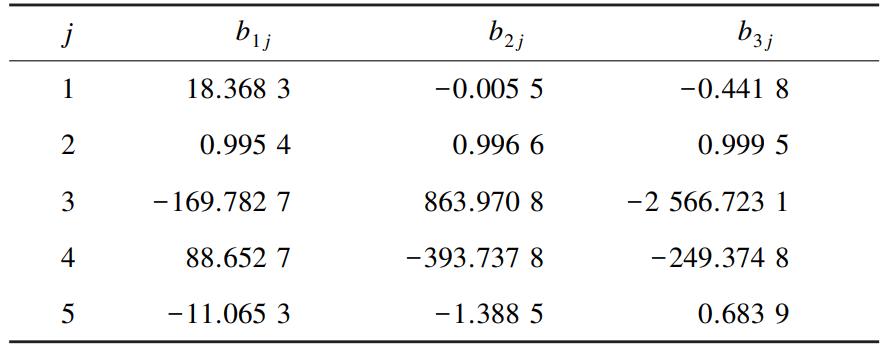
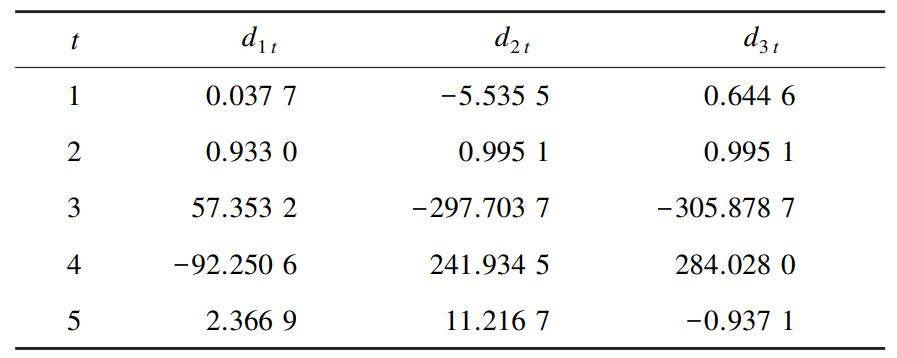
The elastic modulus 𝐸 of the material was set to200 GPa,the yield stress 𝜎y varied from 200 MPa to1 000 MPa in increments of 200 MPa,the strain hardening index 𝑛 ranged from 0.1 to 0.4 with a step size of 0.1.Under power-law elastoplastic conditions,FEA was employed to obtain the equivalent stress and equivalent strain distributions of the Discch specimen for a total of 20 combinations of the constitutive parameters 𝜎y and 𝑛. Using 𝜎C and 𝜀C as characteristic quantities,regression was performed based on Eq.(23)to determine the parameter values of 𝑏𝑘𝑗 and 𝑑𝑠𝑡,which are provided in Tables 3 and 4,respectively.
Table
3
Stress field model parameters bkj values
Note:All parameters are dimensionless.
Table
4
Strain field model parameter 𝑑𝑠𝑡 values
Note:All parameters are dimensionless.
4 Model Validation
4.1 Finite Element Analysis Validation
4.1.1 Verification of load⁃displacement model
To validate the universality and predictive accuracy of the load-displacement model across a range of materials,systematic simulations were conducted with the elastic modulus 𝐸 of the sample material set to 200 GPa. The yield stress 𝜎y was varied from 300 MPa to 900 MPa in increments of 200 MPa,and the strain hardening index 𝑛 was assigned values from 0.1 to 0.4 in steps of 0.1. FEA was performed to obtain the load-displacement response for various combinations of 𝜎y and 𝑛. The loading coefficient 𝐶 and loading index 𝑚 for the respective materials are calculated using Eq.(11),which incorporates parameters 𝑘₁ to 𝑘₄ from Table 1.Based on these values,the 𝑃-ℎ curve predicted by the load-displacement model was plotted. As illustrated in Fig. 6,the model results show excellent agreement with the FEA data,achieving a goodness-of-fit greater than 0.96.
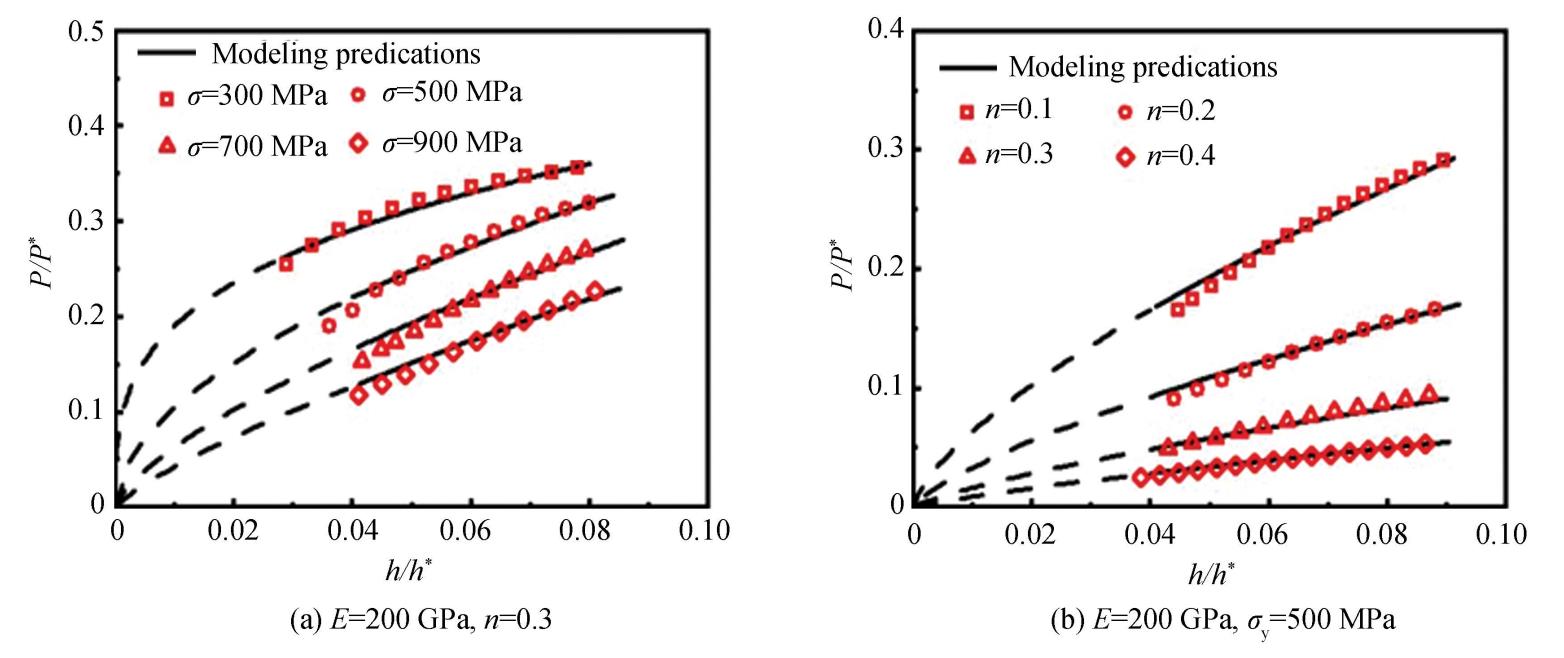
Fig.
6
Comparison between the predicted results of the load-displacement model and the FEA results under different material parameters (𝐸,𝜎y,𝑛)(Solid lines denote the actual calculation range,while dashed lines are only added for visual continuity)
Reverse validation involves fitting a Stage II curve segment of the Discch sample in SPT monotonic loading with the function 𝑃/ 𝑃∗= 𝐶(ℎ/ ℎ∗)𝑚,from which the loading index m and coefficient 𝐶 are determined. According to Eq.(13),the H-law parameters 𝑛,𝐾,and 𝜎y are derived. The outcomes of this inverse analysis are then graphically compared with the known H-law parameters,as displayed in Fig. 7. The results demonstrate that the inverse prediction performs well.
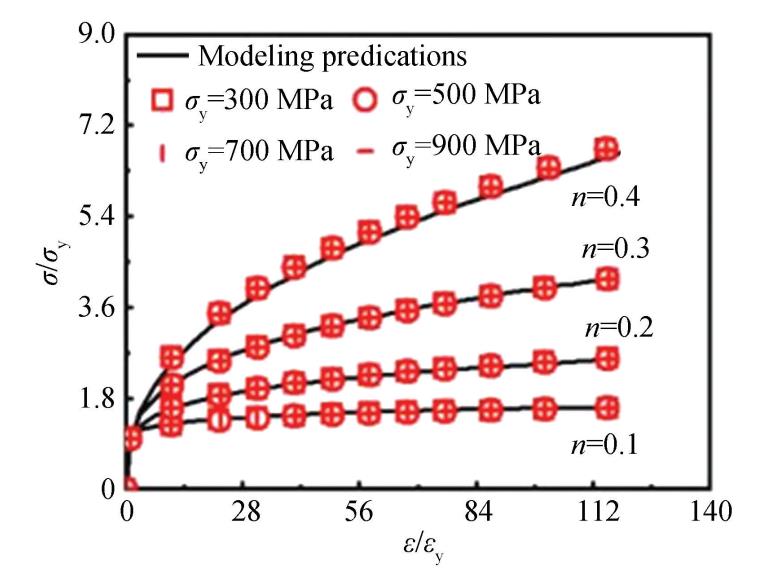
Fig.
7
Comparison of reverse predicted values of load-displacement model and true values under different material parameters (𝐸,𝜎y,𝑛)
In summary,across a broad spectrum of H-law constitutive parameters typical of conventional engineering materials,both the load-displacement model,and the reverse prediction of H-law parameters for the Discch sample in SPTLCF show close agreement with the FEA curves.
4.1.2 Verification of stress⁃strain field model
The elastic modulus E of the compressed material was preset to 200 GPa. The yield stress 𝜎y was varied from 300 MPa to 900 MPa in increments of 200 MPa,and the strain hardening index 𝑛 was assigned values from 0.1 to 0.4 in steps of 0.1. Scatter plots were generated to represent the dimensionless stress 𝜎eq/ 𝜎C,dimensionless strain 𝜀eq/ 𝜀C,and radial position ratio 𝑟/ 𝑅. Based on Eq.(15),all computational results were compared to the FEA,as depicted in Fig.8 and Fig.9. The results indicate that the model predictions are in close agreement with the FEA results,with a goodness-of-fit exceeding 0.95.
4.1.3 Verification of maximum stress and strain model
The elastic modulus 𝐸 of the compressed material was again set at 200 GPa,with yield stress 𝜎y values ranging from 300 MPa to 900 MPa in increments of 200 MPa,and strain hardening index 𝑛 varying from0.1 to 0. 4 in increments of 0. 1. The loading displacement was set between 0.06 mm and 0.2 mm,with increments of 0.02 mm. Scatter plots were generated for maximum stress 𝜎eq⁃max and maximum strain 𝜀eq⁃max about the dimensionless displacement ℎ/ ℎ∗. As described in Section 2. 5,the stress and strain values peak at the clamping end,the FEA results are shown in Fig.10.
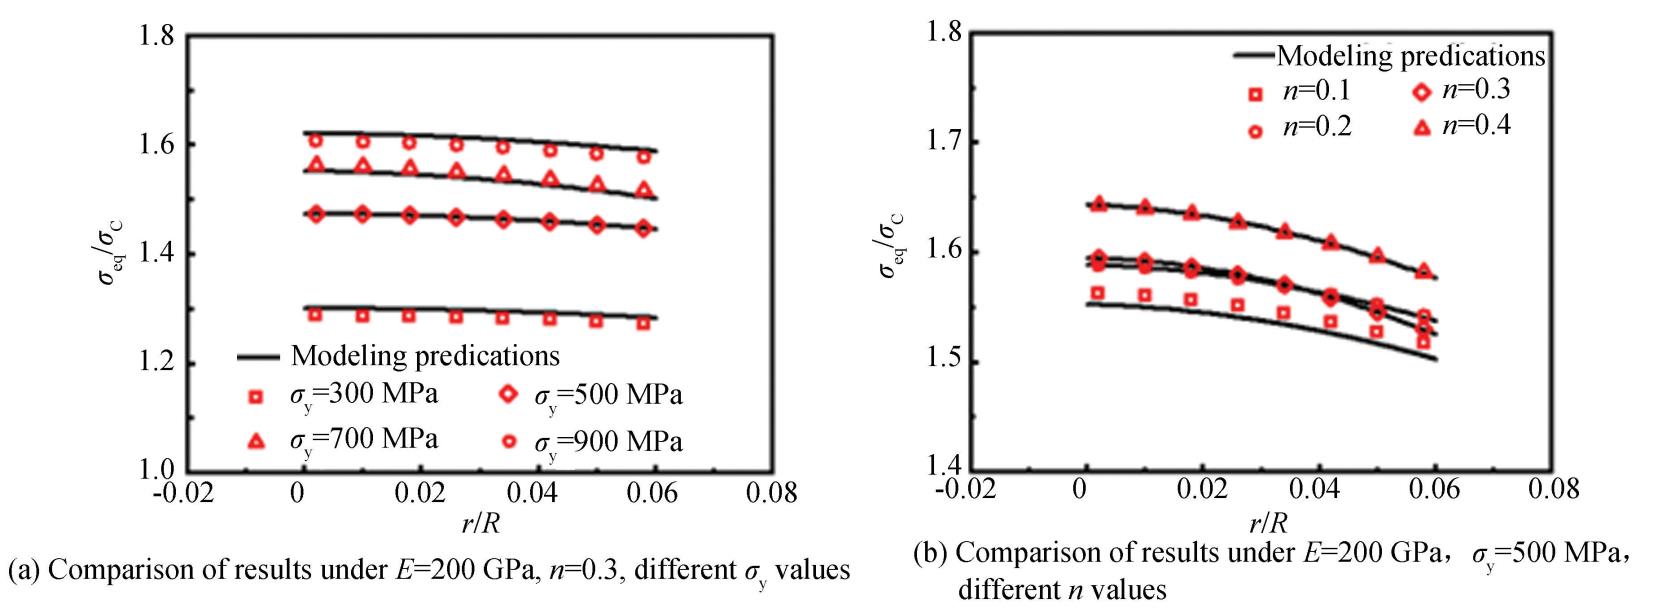
Fig.
8
Comparison of stress field model prediction results and FEA results
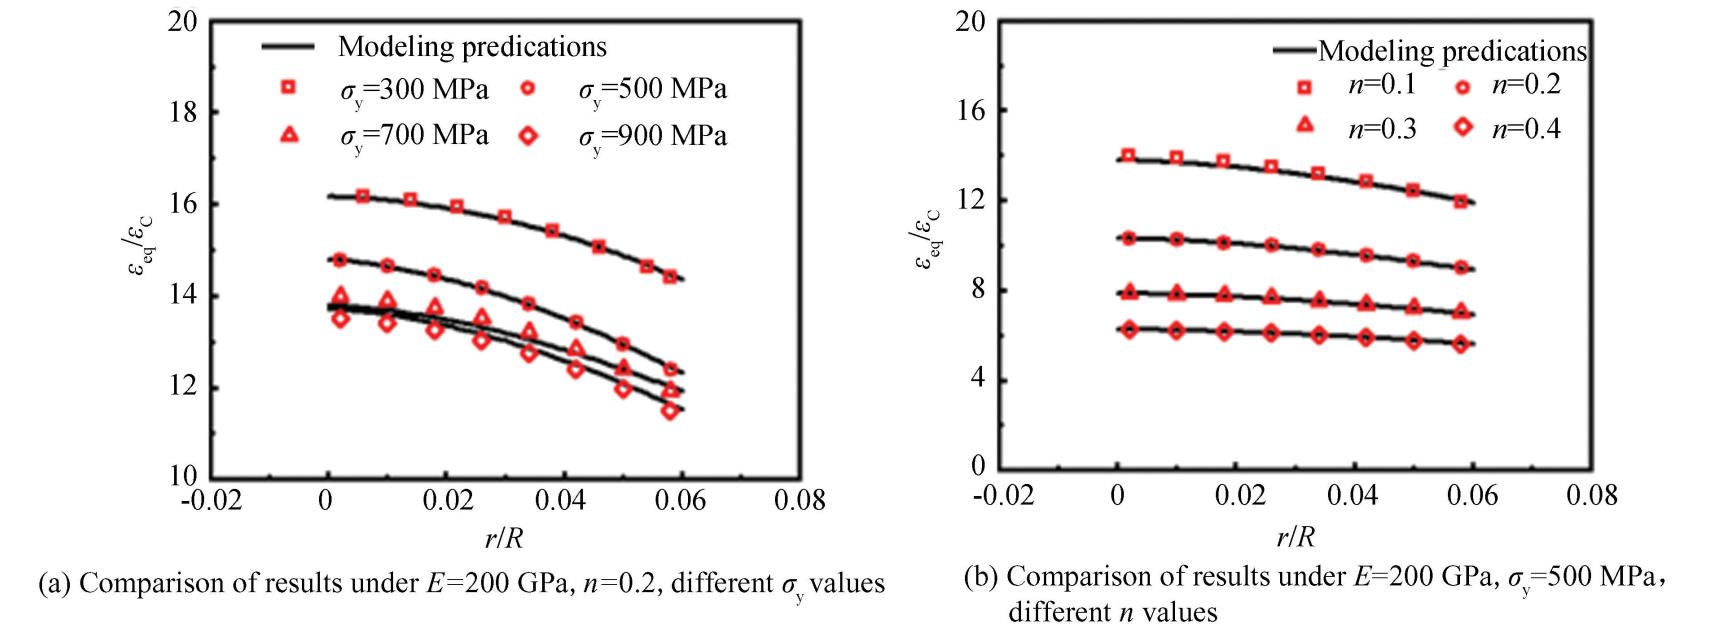
Fig.
9
Comparison of strain field model prediction results and FEA results
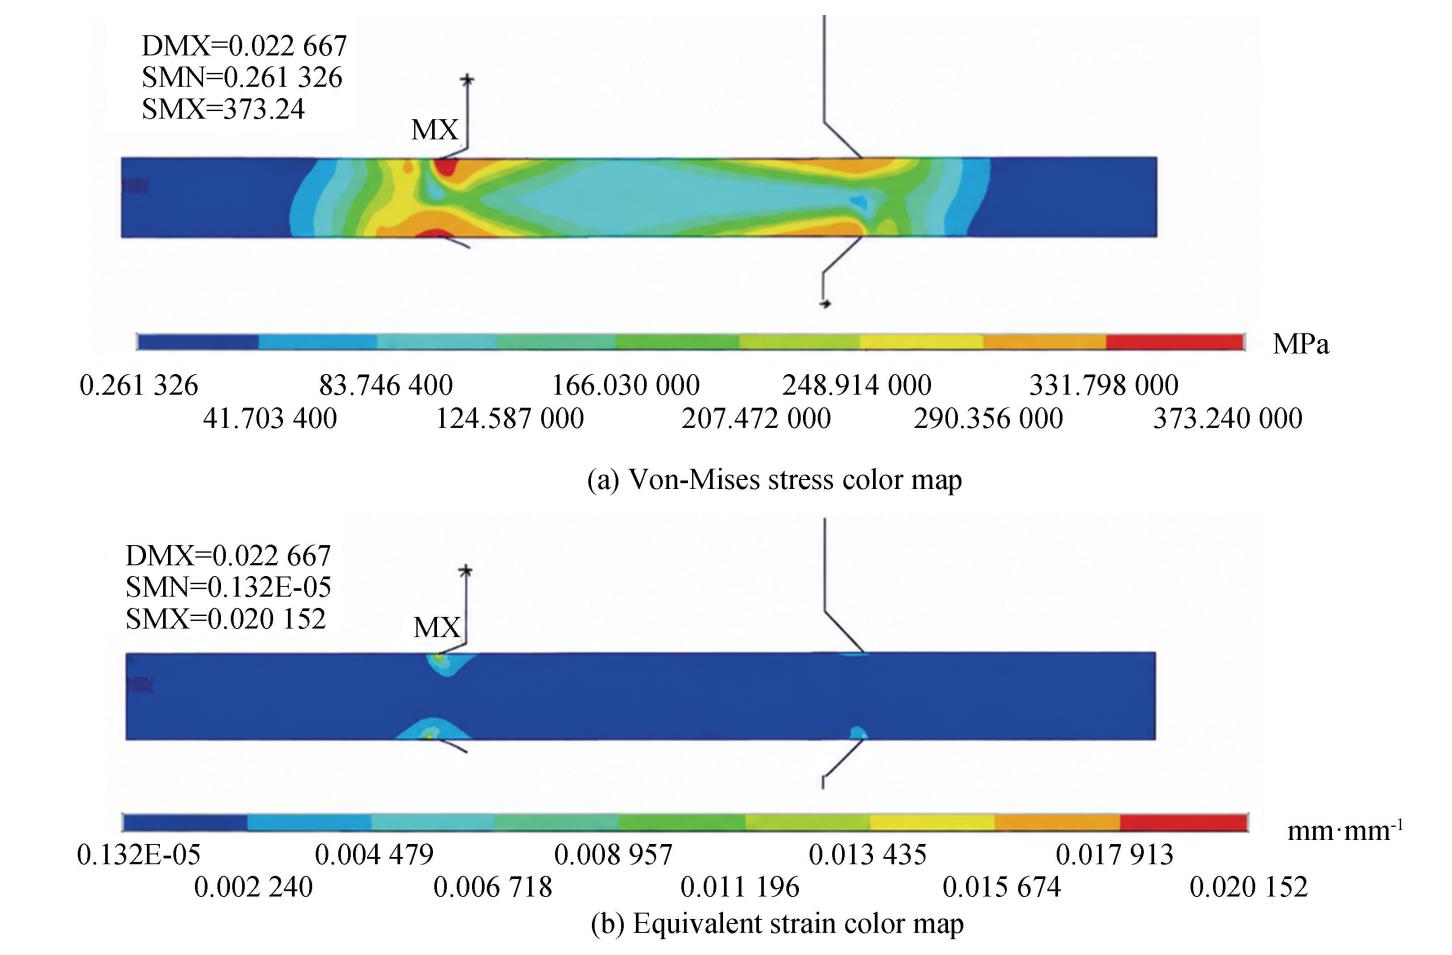
Fig.
10
Stress and strain distribution,location and magnitude of Discch specimen under a loading displacement of 0.06 mm
A comparative analysis between the analytical predictions derived from Eq.(17)and FEA results are presented in Fig. 11 and Fig. 12. The model demonstrates strong agreement with FEA simulations,with relative errors less than or equal to 6% for maximum stress predictions and less than or equal to4% for maximum strain estimates.
4.2 Experimental Methods and Applications
4.2.1 A new SPT method for obtaining cyclic steady⁃state stress⁃strain relationship
Based on the theoretical framework relating equivalent stress amplitude to equivalent strain amplitude,the stress-strain relationship of a material in a cyclically stable state can be directly determined from displacement and load amplitude data. The specific experimental procedure is described as follows.
Through experimental data acquisition and processing,stabilized axial displacement-load hysteresis loops were obtained at each controlled displacement amplitude level. The load amplitude(𝑃a)and displacement amplitude(ℎa)correspond to the maximum cyclic load(𝑃max)and maximum displacement(ℎmax)measured during testing. By interpolating the vertex coordinates(𝑃max,ℎmax)of the hysteresis loops,the displacement-load amplitude curve 𝑃a-ℎa was constructed. The equivalent cyclic stress amplitude 𝜎eq⁃C⁃a and equivalent cyclic strain amplitude 𝜀eq⁃C⁃a were then calculated directly from the 𝑃a-ℎa curve using the theoretical equivalence relationships between stress amplitude and strain amplitude.
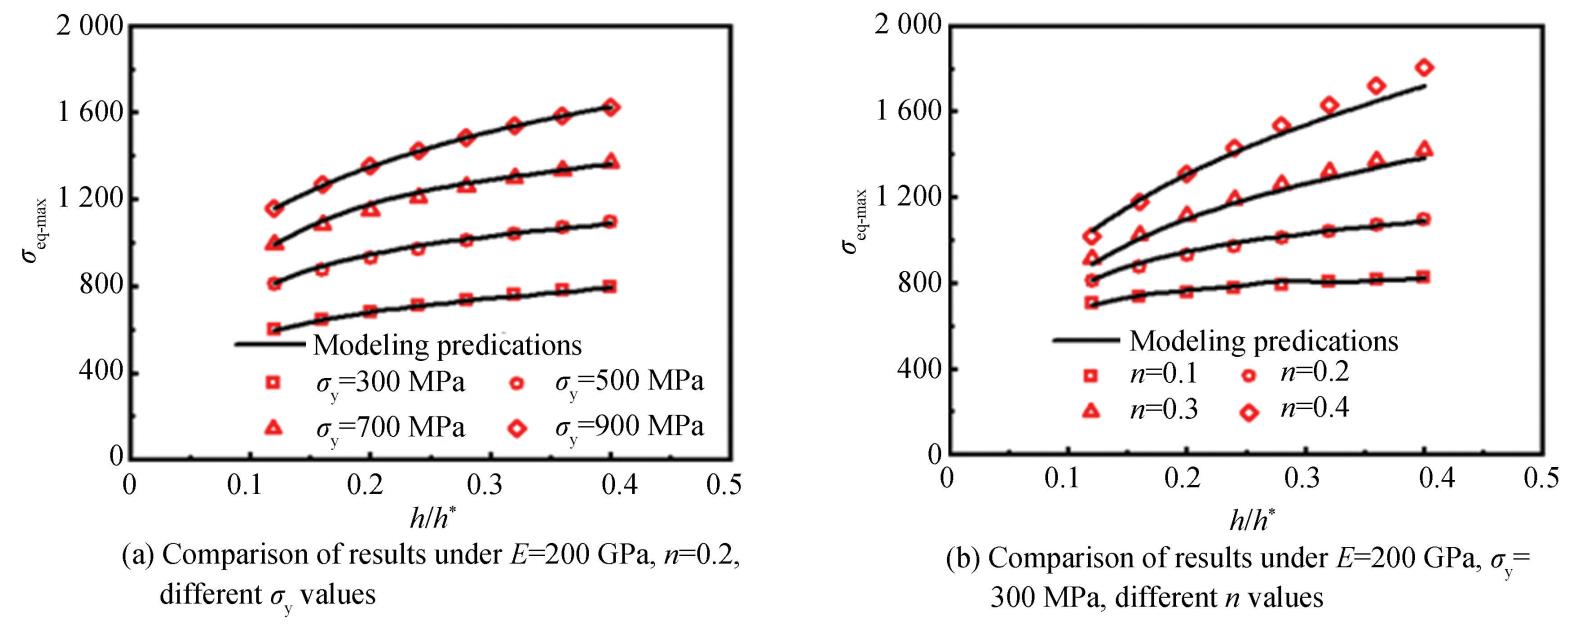
Fig.
11
Comparison between the predicted results of the maximum stress model and FEA results
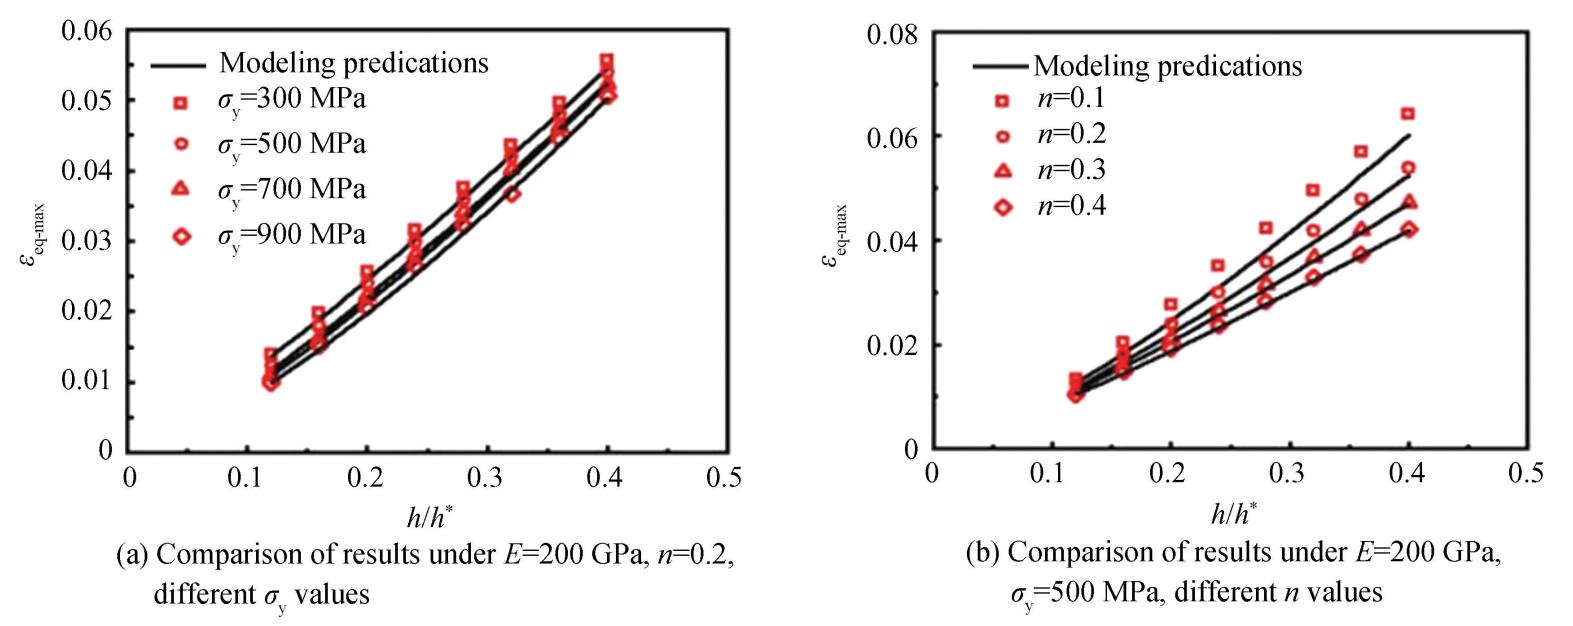
Fig.
12
Comparison between the predicted results of the maximum strain model and FEA results
For the metal materials 316L and P91,stabilized axial displacement-load hysteresis loops(HL)were obtained from Discch specimens subjected to varying displacement amplitudes. The load amplitude 𝑃a and displacement amplitude ℎa,derived from the maximum cyclic load 𝑃max and displacement ℎmax,were used to construct 𝑃a-ℎa curves based on hysteresis loop vertex data. Fig.13 illustrates the HL and 𝑃a-ℎa curves for Discch specimens made of 316L and P91 materials.The 𝜎eq⁃C⁃a and 𝜀eq⁃C⁃a were derived directly from the 𝑃a-ℎa curve using the theoretical equations for cyclic equivalent stress and strain amplitudes.
Fig.14presents the cyclic stable 𝜎a-𝜀a curves and the monotonic 𝜎-𝜀 curves of the standard round bar specimen,as well as the cyclic stable 𝜎eq⁃C⁃a⁃εeq⁃C⁃a curves of Discch specimens. The 𝜎a-𝜀a curves obtained from Discch specimens show strong consistency with experimental data from standard round bar specimens,indicating geometric independence in the steady-state cyclic stress-strain behavior. This agreement confirms that strain-controlled cyclic deformation is governed by intrinsic material properties rather than specimen geometry. Notably,the cyclic 𝜎a-𝜀a curves for both materials lie above their monotonic counterparts,illustrating the effect of cyclic hardening.
Table5summarizes the H-law parameters for both materials obtained using this experimental method under monotonic and cyclic steady-state conditions.
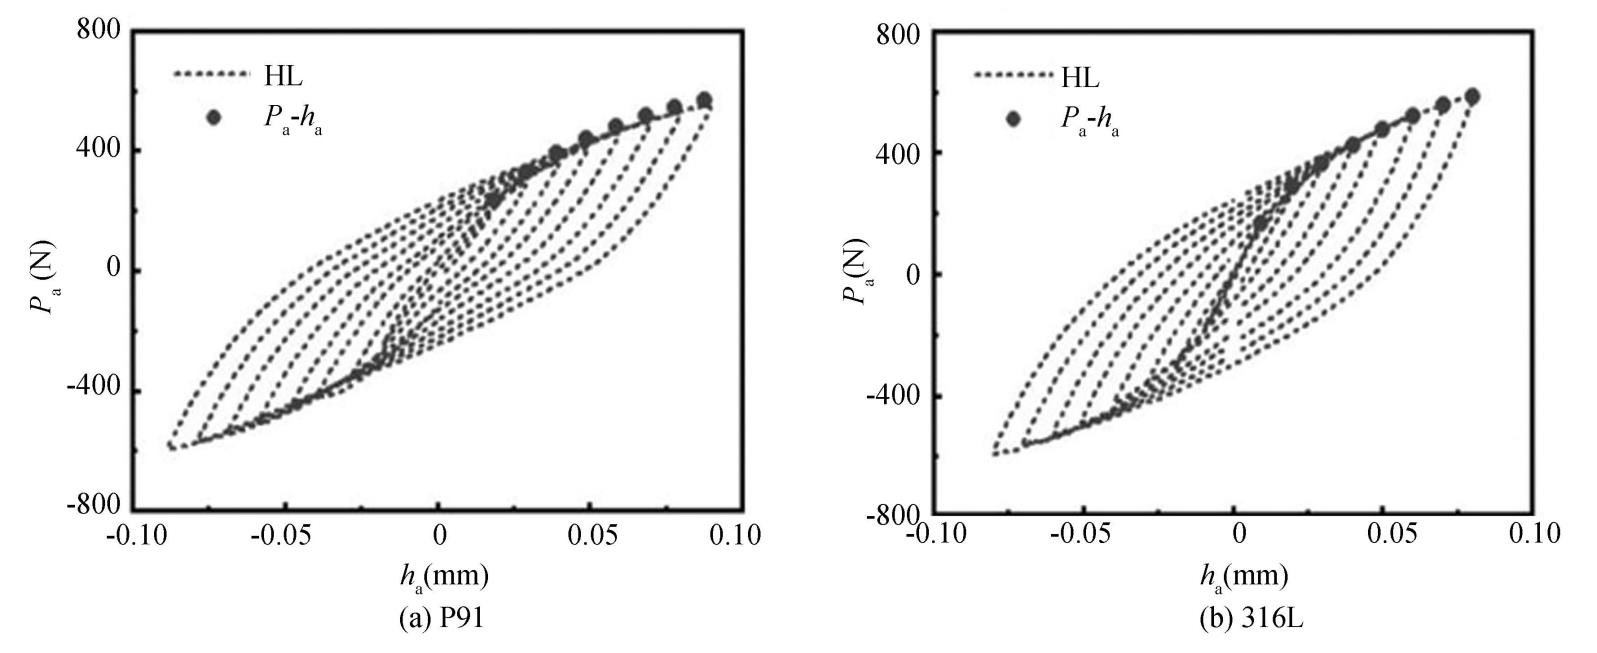
Fig.
13
Discch sample cyclic stable HL and 𝑃a-ℎa curves
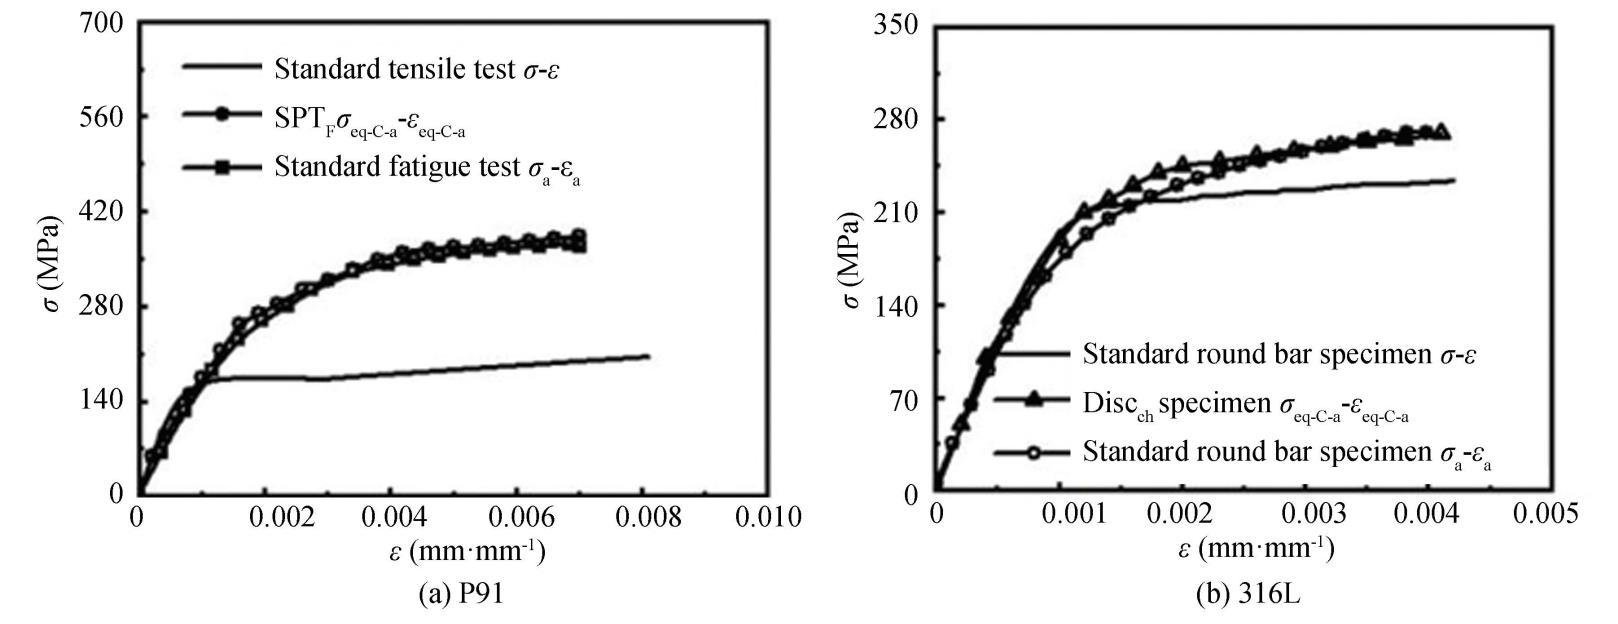
Fig.
14
Comparison of cyclic stress-strain amplitude curves between Discch specimens and standard round bar specimens
Table
5
Monotonic and cyclic constitutive relationship parameters

4.2.2 A novel small punch fatigue test methodology
By incorporating the previously determined H-law parameters of the material's cyclic stress-strain relationship into the maximum stress-strain model,the theoretical stress amplitude and strain amplitude at critical failure locations were calculated for the corresponding load amplitude and loading displacement amplitude. Based on these results,the associated sequences of strain amplitude and displacement-controlled SPTLCF life were obtained. Finally,the LCF properties of the material were derived using the Manson-Coffin law. This overall procedure constitutes the novel SPTLCF methodology for determining the low-cycle fatigue performance of metallic materials.
Inherent manufacturing tolerances and experimental uncertainties introduce systematic discrepancies between the measured load PT and theoretical load 𝑃a.Eq.(17)indicates a positive correlation between the load and the strain amplitude. The theoretical strain amplitude 𝜀T,stress amplitude 𝜎T,were empirically calibrated against their experimental counterparts 𝜀a and σa using the correction formula in Eq.(24):
(24)
During SPTLCF,Discch specimen was subjected to a multiaxial stress state. Localized crack initiation preferentially occurs at either the upper or lower surface due to stress concentration,leading to progressive material degradation. Nevertheless,due to the symmetrical loading of Discch,relative resistance such as frictional force is generated at the crack,with the sample moving up and down. This mechanism causes the overall displacement amplitude to decline more slowly than the peak and valley displacement amplitudes,as illustrated in Fig.15. Therefore,a 5% reduction in the peak/ valley displacement amplitude is adopted as the failure criterion for the specimen.
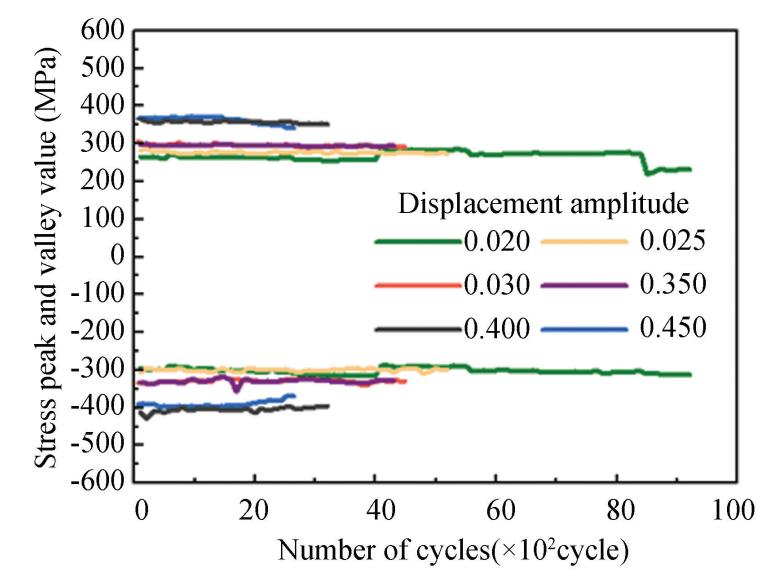
Fig.
15
Diagram of stress amplitude variation with the number of cycles
Under cyclic loading,localized damage nucleates at the contact endpoints of the flat punch or within the clamping regions of the upper and lower fixtures on the Discch specimen surfaces. With increasing number of cycles,fatigue cracks propagate progressively,consistent with predictions from the maximum stress-strain model and FEA results. Fig. 16 shows the fractured specimen and the morphology of the localized fatigue cracks.
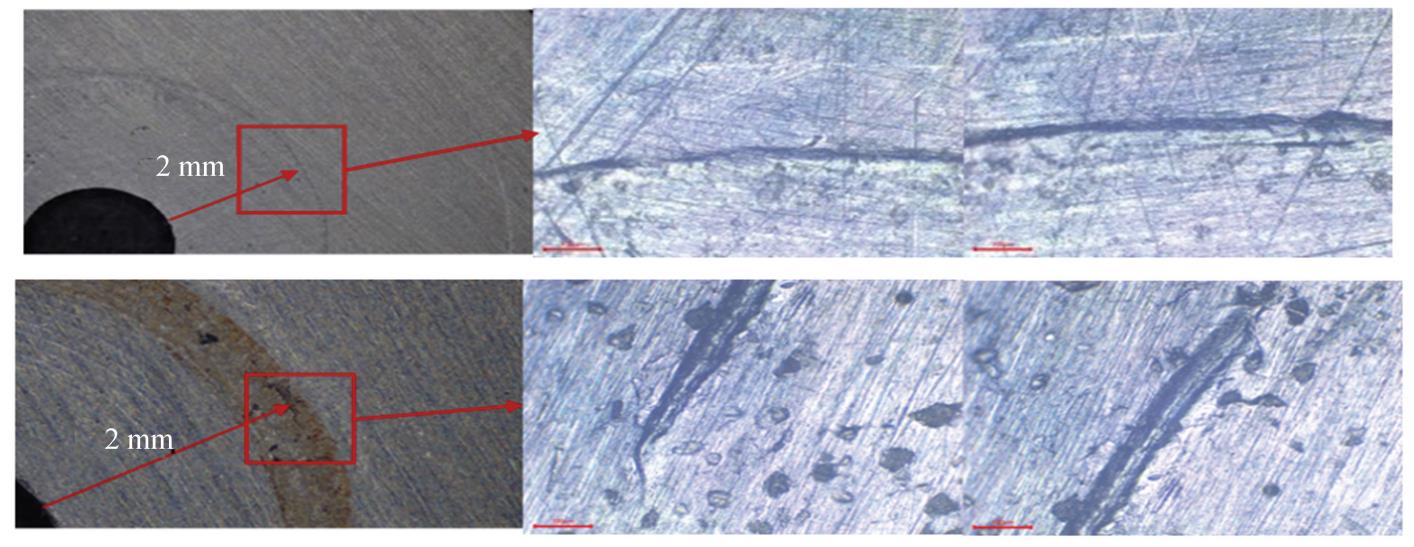
Fig.
16
Fractured specimen and localized fatigue crack
Displacement-controlled symmetric cyclic SPTLCF were performed on Discch specimens of P91 and 316L metallic materials. The maximum stress-strain model was employed to calculate stress amplitude and strain amplitude across varying displacement amplitudes,facilitating fatigue life prediction. The relationship between fatigue life 𝑁f and strain amplitude 𝜀a was quantified using the M-C law,as expressed in Eq.(25).
(25)
where,𝜀eq⁃e⁃C⁃a= 𝜎eq⁃C⁃a/ 𝐸 and 𝜀eq⁃p⁃C⁃a= 𝜀eq⁃C⁃a-𝜀eq⁃e⁃C⁃a are the equivalent elastic strain and plastic strain of the Discch specimen,where 𝑁f denotes fatigue life, is the fatigue strength coefficient,𝑏 is the fatigue strength exponent, is the fatigue ductility coefficient,and 𝑐 is the fatigue ductility exponent.Table 6 summarizes the M-C law parameter values predicted for Discch samples. Fig. 17 compares the M-C law fatigue life curves obtained from Discch specimens and standard round bar specimens,revealing strong alignment. This correlation validates the reliability of the novel testing methodology for LCF performance evaluation.
Table
6
Law parameters of two materials

Fig.18illustrates the relationship between the double life(2𝑁f⁃S)of Discch specimens(P91 and 316L steels)derived from the novel SPTLCF methods and the predicted fatigue life(2𝑁f⁃B)based on standard round bar specimens. The diagonal “ exact solution ” line represents theoretical equivalence between specimen types,while parallel dashed lines delineate a two-fold safety factor. Experimental data demonstrate that all 2𝑁f⁃S-2𝑁f⁃B points fall within the safety boundaries,with deviations complying with acceptable engineering tolerances.
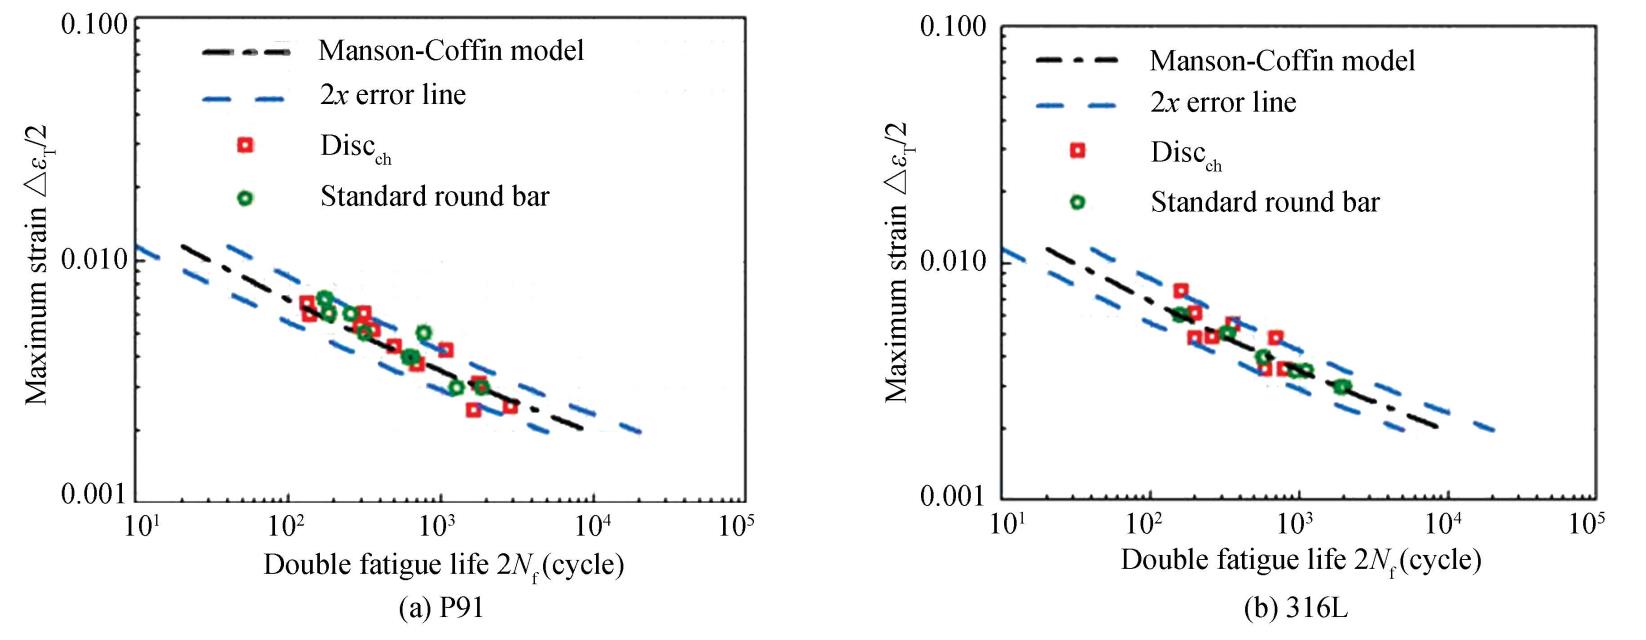
Fig.
17
Fatigue life prediction curve
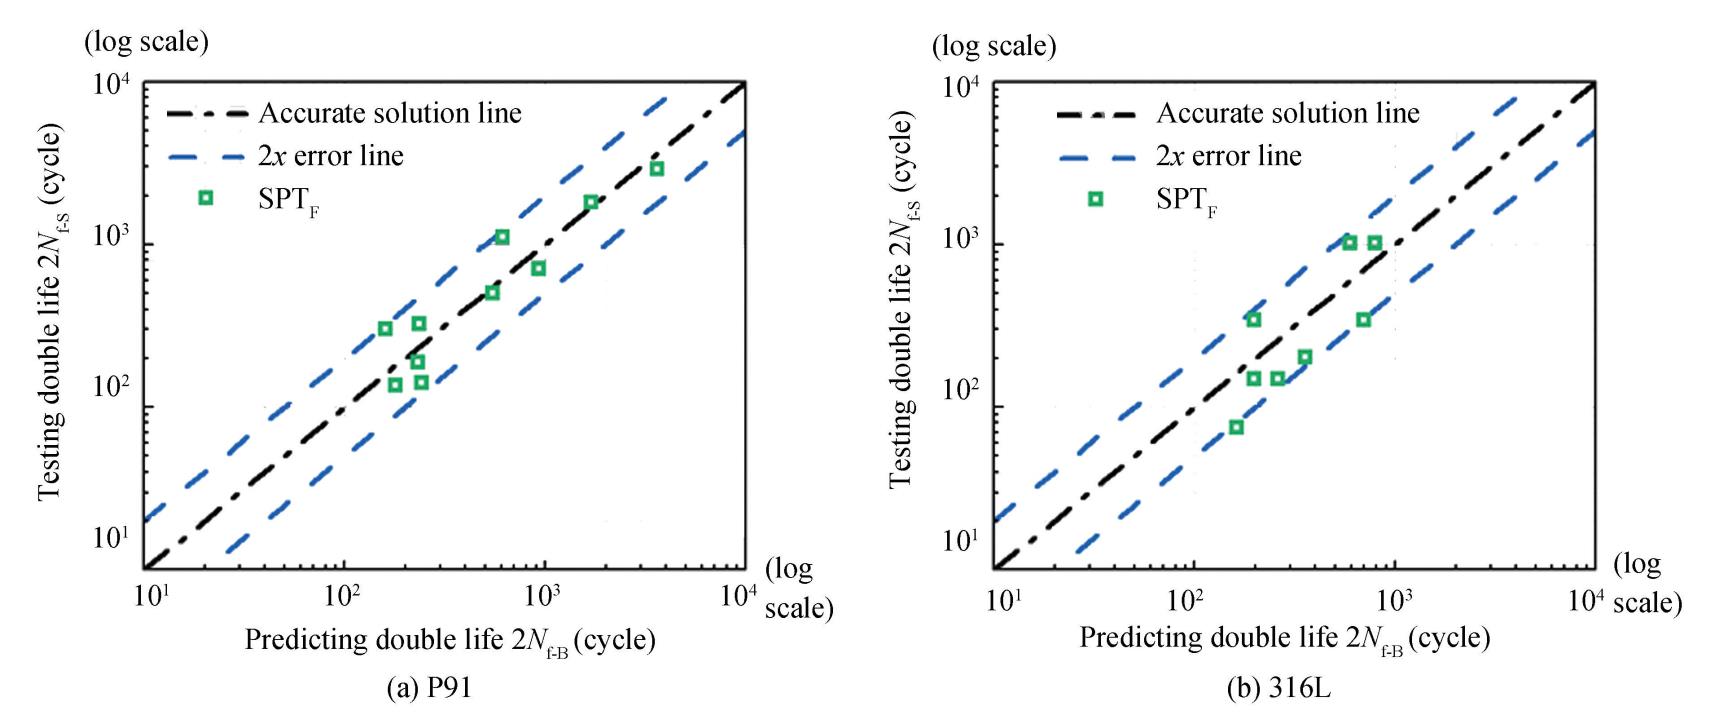
Fig.
18
Scatter plot of double life curve of SPTLCF with Discch specimen-predicted double life
Although the number of specimens was insufficient to permit a rigorous statistical analysis of fatigue life scatter,the data obtained from both the small punch fatigue tests and the standard uniaxial fatigue tests(Fig. 17 and Fig. 18)reveal clear and consistent trends. These results demonstrate that the small punch fatigue testing method can be effectively applied to evaluate material fatigue performance.
5 Conclusions
This study establishes a combined theoretical and experimental framework for determining the cyclic steady-state stress-strain relationship and evaluating the low-cycle fatigue(LCF)properties of materials using Discch specimens under displacement-controlled small punch fatigue testing(SPTLCF). The main findings are summarized as follows:
1)Four analytical models have been developed:a displacement-load model,an equivalent stress-strain model,a stress-strain field model,and a maximum stress-strain model. Simulations performed on a range of materials show that the predicted stress-strain results deviate by less than 4% from reference values,confirming the accuracy and universality of the proposed models.
2)Based on the equivalent stress-strain model,a novel displacement-controlled SPT methodology has been developed to determine the stress-strain relationship of materials under cyclic steady-state conditions. To validate this approach,multi-stage symmetric displacement-controlled cyclic SPT tests were carried out on Discch specimens of 316L stainless steel and P91 steel. For comparative purposes,multi-stage symmetric strain-controlled cyclic tests were also conducted on conventional straight round bar specimens. The cyclic steady-state stress-strain curves obtained from the Discch specimens show close agreement with those derived from the standard specimens,with deviations of less than 4%.
3)Based on the four proposed theoretical models,a conversion relationship has been established to correlate the cyclic steady-state load amplitude and displacement amplitude with the stress amplitude and strain amplitude at the critical failure point of the specimen. By incorporating the local stress-strain approach and substituting the axial stress-strain terms in the Manson-Coffin law with the equivalent stress-strain values at the failure location,a universally applicable SPTLCF methodology has been developed for Discch specimens across a variety of materials and geometries. SPTLCF was performed on Discch specimens of 316L stainless steel and P91 steel. The Manson-Coffin law parameters obtained using the novel SPTLCF method show good agreement with those derived from standard round bar tests.
This study provides a preliminary validation of the feasibility of the small punch fatigue testing method for evaluating material fatigue performance. It should be noted that the current conclusions are based on a limited sample size,and thus their statistical confidence is constrained. Future work will involve increasing the number of specimens to comply with the ASTM E739-23 standard guide,with the aim of establishing a more statistically significant fatigue life database and design allowable curves.
Conflict of Interest
The authors declare no potential conflict of interest.
